The Natural History Collections FMN will focus on several modules:
- Module 1: The Relationship between Island Size and Species Richness [Island Biogeography]
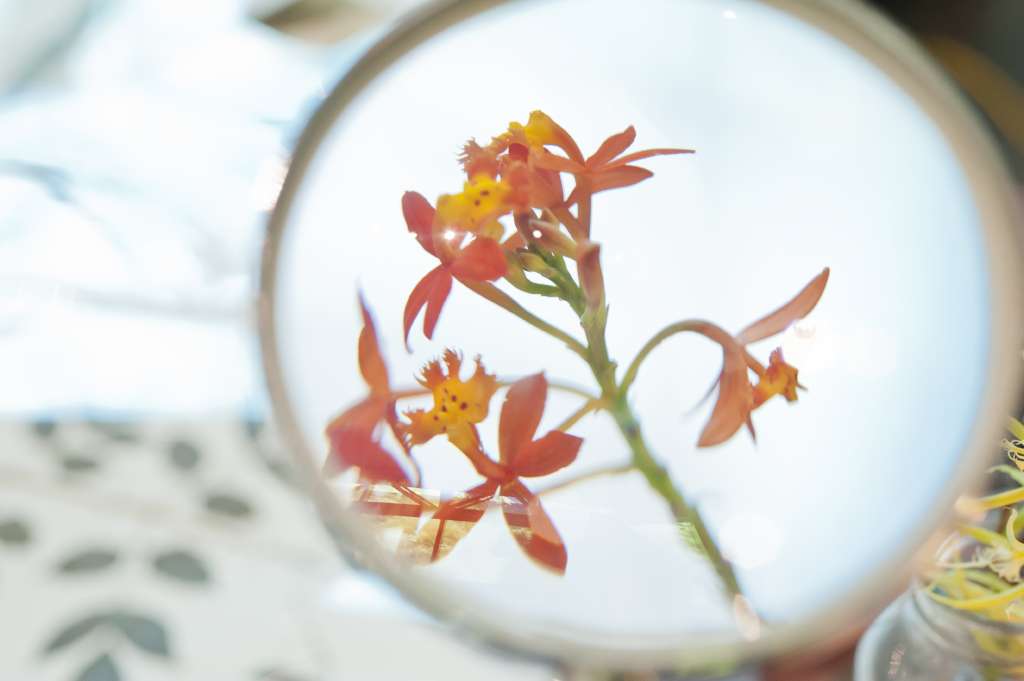
- Module 2: The Evolution (and Coevolution) of Flowering Plants
- Module 3: The Effect of Climate Change on Phenology and Interspecific Interactions
- Module 4: Mammal Size on Islands [Island Biogeography]
Module 1: The Relationship between Island Size and Species Richness [Island Biogeography]
Suited for Upper-Level Undergraduates
Course:
- Introductory Biology or Ecology (Freshmen or Sophomores)
Length:
- This exercise is designed as a 2-3-hour experience, but could be spread over several days or include a take-home component.
- The assessment is completed as a take-home assignment.
Objectives:
- Interpret patterns of species distribution on islands using natural history collections data.
- Apply the process of science by the development and testing of hypotheses.
- Collect, clean, and analyze data from a digitized natural history collection.
Activities:
- Students make a prediction about the relationship between island size and species richness.
- Students use an aggregated online database to download species collection records from islands of different size classes in the Alexander Archipelago.
- Students determine the number of mammal species collected on each of the selected islands. This activity requires significant time for data “cleaning”.
- Students do statistical analyses of the data (t-test, ANOVA, or regression) to test their hypotheses.
Assessment:
- Students complete a standard laboratory report detailing their methods and findings.
Read more about this module and download the materials here.
Module 2: The Evolution (and Coevolution) of Flowering Plants
Course:
- Introductory Biology, Ecology, or Evolution (Freshmen or Sophomores)
Length:
- This exercise is designed as a 3-hour laboratory experience, but activities could be used individually.
- The assessment is completed as a take-home assignment.
Objectives:
- Describe the role of flowers in angiosperm reproduction.
- Identify the parts of a flower.
- Describe the role of fruits in angiosperm reproduction.
- Identify the parts of a fruit.
- Identify different types of fruits.
- Explain the role of pollinators in the life history of angiosperms.
- Define coevolution and identify selection pressures that exist between pollinators and the plants they pollinate.
- Predict pollinator/plant pairs based on morphological traits.
- Collect data from digitized natural history collections.
- Analyze spatial co-occurrence data for pollinators and the plants they pollinate.
Activities:
- Flower dissection and drawing [30 min] – each pair of students is assigned a flower to dissect and draw.
- Plant/Pollinator match game [30 min] – each student receives either a pollinator or plant “card” and must locate their match using information provided on the card.
- Bat/Agave case study using digitized Natural History Collection data [60 min] – students use the iDigBio Portal to investigate the distribution of several bat and plant species to analyze spatial co-occurrence data to make inferences about interspecific interactions.
- Fruit dissection, drawing, stations [45 min] – each pair of students is assigned a fruit to identify, dissect, and draw. The team then produces a “station” displaying their fruit for other class members to view.
Assessment:
- Students complete a case study assessment investigating the relationship between the early spider orchid (Ophyrs sphegodes) and its pollinator, the solitary bee (Andrena nigroaenea).
- Students use images to identify characteristics of the orchid flower and fruit, use the iDigBio Portal to investigate the co-occurrence of the two species, and write about the selection pressures involved in the co-evolutionary relationship.
Read more about this module and download the materials here.
Module 3: The Effect of Climate Change on Phenology and Interspecific Interactions
Course:
- Introductory Ecology (Sophomores or Juniors)
Length:
- This exercise is designed as a 3-hour laboratory experience.
- The assessment is completed as a take-home assignment.
Objectives:
- Measure shifts in the timing of life history events due to climate change.
- Predict the effects of phenology shifts on interspecific interactions.
- Collect, clean, and analyze data from a digitized natural history collection.
Activities:
- Students collect temperature data from weather/climate database.
- Students collect data on butterfly plants phenology from digitized natural history collections.
- Students collect data on butterfly phenology from digitized natural history collections.
- Students analyze the three data sets to identify correlations between temperature change and shifts in the phenology of butterfly food plants and butterflies.
- Students make predictions about the effects of phenology shifts on the population sizes of the plants and butterflies.
- Students read parts of a primary literature article about the phenology of the pied flycatcher and its prey, butterfly larvae, and draw conclusions about the interactions between all three groups (butterfly food plants, butterflies, and flycatchers).
Assessment:
- Students complete a case study assessment investigating phenology shifts in the early spider orchid (Ophyrs sphegodes) and its pollinator, the solitary bee (Andrena nigroaenea).
- Students graph provided temperature, flowering time, and date of first bee flight data to visualize the changes in phenology.
- Students make predictions about the effects of the phenology shifts on the orchid population.
Downloadable version coming soon.
Module 4: Mammal Size on Islands [Island Biogeography]
Course:
- Upper Level Ecology (Juniors or Seniors)
Length:
- This exercise is designed as a 2-3-hour experience, but could be spread over several days or include a take-home component.
- The assessment is completed as a take-home assignment.
Objectives:
- Interpret patterns of species morphology on islands using natural history collections data.
- Apply the process of science by the development and testing of hypotheses.
- Collect, clean, and analyze data from a digitized natural history collection.
Activities:
- Students make a prediction about the relationship between mammal body size and island vs mainland habitat.
- Students use the Arctos online database to download species collection records from islands in the Alexander Archipelago and from the nearby Alaska mainland.
- Students determine the average mass of different mammal species collected on the islands and mainland. This activity requires significant time for data “cleaning”.
- Students do statistical analyses of the data (t-test) to test their hypotheses.
Assessment:
- Students complete a standard laboratory report detailing their methods and findings.
Read more about this module and download the materials here.