Collections
Drew LaMar created this post
@
on
Understanding Statistical Power and Significance Testing: An Interactive Visualization
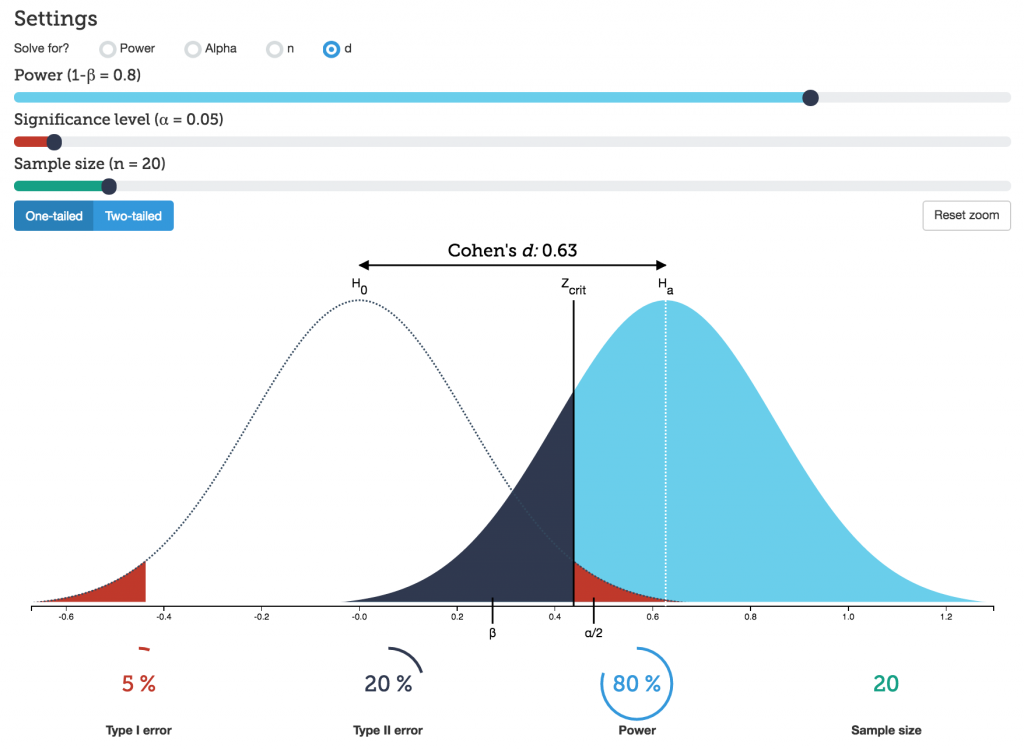
This visualization is meant as an aid for students when they are learning about statistical hypothesis testing. The visualization is based on a one-sample Z-test. You can vary the sample size, power, signifance level and effect size using the sliders to see how the sampling distributions change.
Created by Kristoffer Magnusson
Drew LaMar onto Visualizing Statistics
@
on
Visualizing Statistics
This collection contains visualizations and animations to help students grasp statistical concepts.
Drew LaMar
@
on