874 total view(s), 401 download(s)
Happels_Intro_to_R.swc(SWC | 9 KB)
LAT data for R.csv(CSV | 2 KB)
Self-guided R.docx(DOCX | 352 KB)
- License terms
Description
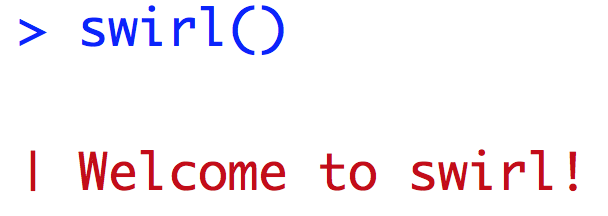
This is geared toward students whom are unfamiliar with R, but generally know about the analysis being conducted within it. With the guidance of swirl prompts, students learn about Rs computational functions, assigning values, and reading-in data from csv.
This was implemented in a 50 min lecture portion of an Introduction to Fish Biology course. Students have already learned that the mass of a fish can be predicted given the length of a fish using a power function. The 50 min were enough time for a handful of students to nearly complete both lessons, conversely a handful were not even halfway through. Students were given extra credit in the remainder of the course if they completed the lessons and proved they learned from them by making a plot using new data collected during labs. The attached word file was given to students to help them get started on the self-guided lesson.
Cite this work
Researchers should cite this work as follows:
- Happel, A. (2019). Exploring the functionality of R. Reducing Barriers to Teaching with R in Undergraduate Biology, QUBES Educational Resources. doi:10.25334/Q4MT7V
