Unwrapping Enzyme Kinetics
Editor: Neena Grover
Published online:
Abstract
Enzyme rates and kinetics are key components used by biochemists to understand how enzymes function. However, students often find it difficult to understand how these experiments are performed and how they reflect enzyme behavior in solution. The microscopic behaviors which compose KM, Vmax, and other kinetic parameters are not easy to see, hindering clear incorporation of kinetics into students' biochemical knowledge. We describe a set of in-class activities where students act as enzymes in order to clarify the behavior of enzymes in solution and to develop a more robust understanding of how kinetics describe this behavior. In the first demonstration, students observe how the rate of candy unwrapping changes over time in a closed system showing how products can slow the progress of an enzyme reaction. In the second demonstration, students observe how substrate concentration and the rate of enzyme reactions are linked and eventually saturate. A final aspect of this lesson helps students learn how to fit their own data to calculate the kinetic values Vmax and KM. Extensions of this activity to enzyme inhibition and active site structure are also described. Students felt more confident in their understanding of enzyme kinetics and action after performing these activities.
Citation
Berndsen CE, Roy IR, Chadrasekharan NP. 2020. Unwrapping enzyme kinetics. CourseSource. https://doi.org/10.24918/cs.2020.47
Society Learning Goals
Biochemistry and Molecular Biology
- Energy is required and transformed in biological systems
- How do enzymes catalyze biological reactions?
Lesson Learning Goals
Initial Rates Activity
- Students will understand the importance of initial rates as applied to enzyme kinetics.
Enzyme Kinetics Activity
- Students will understand how substrate concentration affects enzyme kinetics.
- Students will understand the use of Vmax and KM in describing enzyme behavior.
Kinetics Data Fitting Activity
- Students will understand how to determine the kinetic parameters Vmax and KM from data.
- Students will understand the advantages and disadvantages of direct and Lineweaver-Burk fits of kinetic data.
Lesson Learning Objectives
Students will be able to:
- calculate an initial rate from plotted data.
- describe the effect of substrate concentration and product inhibition on the behavior of enzymes.
- understand why enzymes saturate resulting in hyperbolic rate vs. substrate concentration plots.
- estimate the kinetic parameters Vmax and KM from enzyme saturation data.
- calculate the kinetic parameters Vmax and KM from enzyme saturation data using direct fitting and Lineweaver-Burk methods.
Article Context
Course
Article Type
Course Level
Bloom's Cognitive Level
Vision and Change Core Competencies
Vision and Change Core Concepts
Class Type
Class Size
Audience
Lesson Length
Pedagogical Approaches
Principles of How People Learn
Assessment Type
INTRODUCTION
The kinetics of an enzyme reaction, which describe the ability of the protein to bind to substrate(s) and catalyze the reaction, are fundamental properties of this type of biomolecule. Enzyme behavior was first described by the separate work of Henri and Michaelis and Menten (1). The latter pair is broadly recognized as mathematically describing enzyme behavior with their eponymous equation (1,2). This early treatment of enzyme kinetics assumed a rapid equilibrium between the enzyme and substrate. Briggs and Haldane then added the steady-state approximation to this Michaelis-Menten equation, which is now widely used to describe enzyme catalysis and how it is altered through mutations or changes in enzyme environment (1). Examples of practical applications of enzyme kinetics are in enzyme evolution to measure the improvement in catalytic efficiency in engineered enzymes and in the pharmaceutical industry to determine the effects of an inhibitor on a potential drug target.
Despite the important role of enzyme kinetics for our understanding of biochemistry and the inclusion of this topic in introductory biochemistry and molecular biology courses, we find that students still struggle with the conceptual basis for Vmax, KM, and how to determine these values. Previous approaches to address aspects of this issue have used analogies (3), Pop-it beads (4), coins (5), beans (6), marbles (7), and unscrewing bolts-nuts (8) to have students visualize aspects of kinetics. Even further, there are demonstrations using actual enzymatic reactions in the classroom (9). One limitation of some of these demonstrations is the reliance on moving an object from one location to another, which can obscure from the students the chemical transformations that the enzymes perform. In other cases, the absence of using initial rates for enzyme kinetics can lead to a disconnect between using steady-state/initial velocities and the calculation of kinetic parameters. While much of this can be demonstrated in a lab, biochemistry labs are not required in all cases. Thus, there is an opportunity for further development of these early demonstrations to more completely illustrate enzyme kinetics.
The series of lessons described here build on these previous demonstrations through the use of three linked activities to show how the use of initial rates leads to construction of a saturation curve and a quantitative description of enzyme catalysis. In these activities, we teach enzyme kinetics by having students act as enzymes and unwrap candy to visualize enzyme behavior. These activities demonstrate the need to measure initial rates and the effect of candy concentration (substrate) on the rate of unwrapping. Students then learn to estimate kinetic values from their data and then fit the data in Excel/Sheets to calculate better kinetic values.
Intended Audience
The primary author (Berndsen) teaches this set of lessons at a mid-sized, public PUI in an introductory biochemistry course, which surveys the discipline in a single semester. The class population ranges from 50 to 110 students with a typical number being 80 students. Entry into the course requires two semesters of general chemistry and one semester of organic chemistry. The student population is typically composed of basic science majors and health science majors.
Early versions of this lesson have also been performed with first-year students in medical school biochemistry at a large public research university and in an introductory biology course with first-year college students at a liberal arts college. While not tested by these authors, the activities and lessons require little prior knowledge of chemistry and kinetics, thus this activity could be performed in a high school setting.
Required Learning Time
These lessons are taught over two 75-minute sections with the data fitting activity performed as homework, taking about two hours for most students. It is possible to expand these lessons across three periods or abbreviate them into a single 50 minute period.
Prerequisite Student Knowledge
Students should understand that chemical rates are measured using kinetics, that enzymes accelerate reaction rates or kinetics, and how to estimate values from a plot. It is helpful if students are able to plot data and perform calculations within Microsoft Excel with guidance, however this is not required.
Prerequisite Teacher Knowledge
The teacher should be familiar with enzyme kinetics and the experimental design used to measure initial rates, Vmax, and KM, and they should be proficient in Microsoft Excel.
SCIENTIFIC TEACHING THEMES
Active Learning
Students will play the part of enzymes unwrapping candies, physically demonstrating the action of enzymes in two distinct activities. Following the demonstration, students typically work in groups to analyze their data and then discuss their findings as a class. After the second lesson, students work outside of class to fit the saturation curve data to reinforce how kinetic parameters are determined.
Assessment
Students were assessed based on the homework assignment showing the data fit and their explanations of those data. Further assessment came via questions from an in-class exam and the cumulative course final exam asking students to analyze kinetics data.
Inclusive Teaching
The interactive demonstrations allow students to observe and describe enzyme function in a way that breaks from the traditional lecture or lab didactic style where enzymes are invisible entities. By acting as enzymes, it incorporates a physical connection to the material, which engages students through additional routes. Some of the work is done in small groups with several roles (enzyme, scientist, recorder, etc.), allowing students to participate at their level of comfort or ability. Moreover, in these groups, students can ask questions of each other or the instructor. The whole class works together to determine the candy saturation curve, which again allows students to participate at the level of their comfort and ability. For students who are not mobile, part of the demonstration is measuring the rate of unwrapping in the absence of having to find and bind the candy, thus allowing contributions from those who cannot, or do not want to, run around the class space. The homework data fitting assignment can be completed individually or as a group assignment and outside resources can be consulted if they are appropriately cited and follow the institutional Honor Code.
LESSON PLAN
Initial Rates Activity
Pre-class Preparation
The instructor should prepare bowls or containers with 30 candies to be unwrapped. We prefer to use Jolly Rancher candies made by the Hershey Company; however, other wrapped candies can be used. We prepare one bowl per group and provide an additional bowl for the control assay. A video of the time course demonstration and an example data set are provided on the Open Science Framework to help the instructor and/or students see the desired behavior (https://osf.io/58wtn/).
In-class
Students are provided Handout 1 (Supporting File S1. Enzyme Kinetics - Time Course Activity Sheet) and are asked to follow the instructions on the handout to measure initial rates of candy unwrapping. After the activity is complete, students can eat the candy if they so choose and should answer questions 1-8 in the handout in anticipation of the class discussion. Groups that quickly complete the activity and the questions are encouraged to discuss and compare answers with other groups that are done. Most groups complete these tasks in ~30 minutes.
Next, we discuss the candy unwrapping data. The discussion can take the form of students presenting their plotted data and findings to the class. Additionally, groups/individuals should describe how the student enzyme unwrapped the candy and how this changed over the course of the experiment. The example plot available on the author's Open Science Framework page may be useful for students to compare their data (Figure 1A). Students are also encouraged to plot the time to unwrap each candy, as this plot can illustrate the trend that later candies take longer to unwrap (Figure 1B). The instructor should then lead students to define and discuss the terms "initial rate/velocity" and "product inhibition." We describe the decrease in the unwrapping rate as due to product inhibition because it is visually easy to see the students trying to move the unwrapped candies and wrappers around to find substrate, however saying the slowdown is due to a lack of substrate is also correct. Ultimately, the students should provide an answer to the question: "Which rate calculated from your data is more likely to be an accurate measure of the enzyme's true ability to catalyze the reaction?"
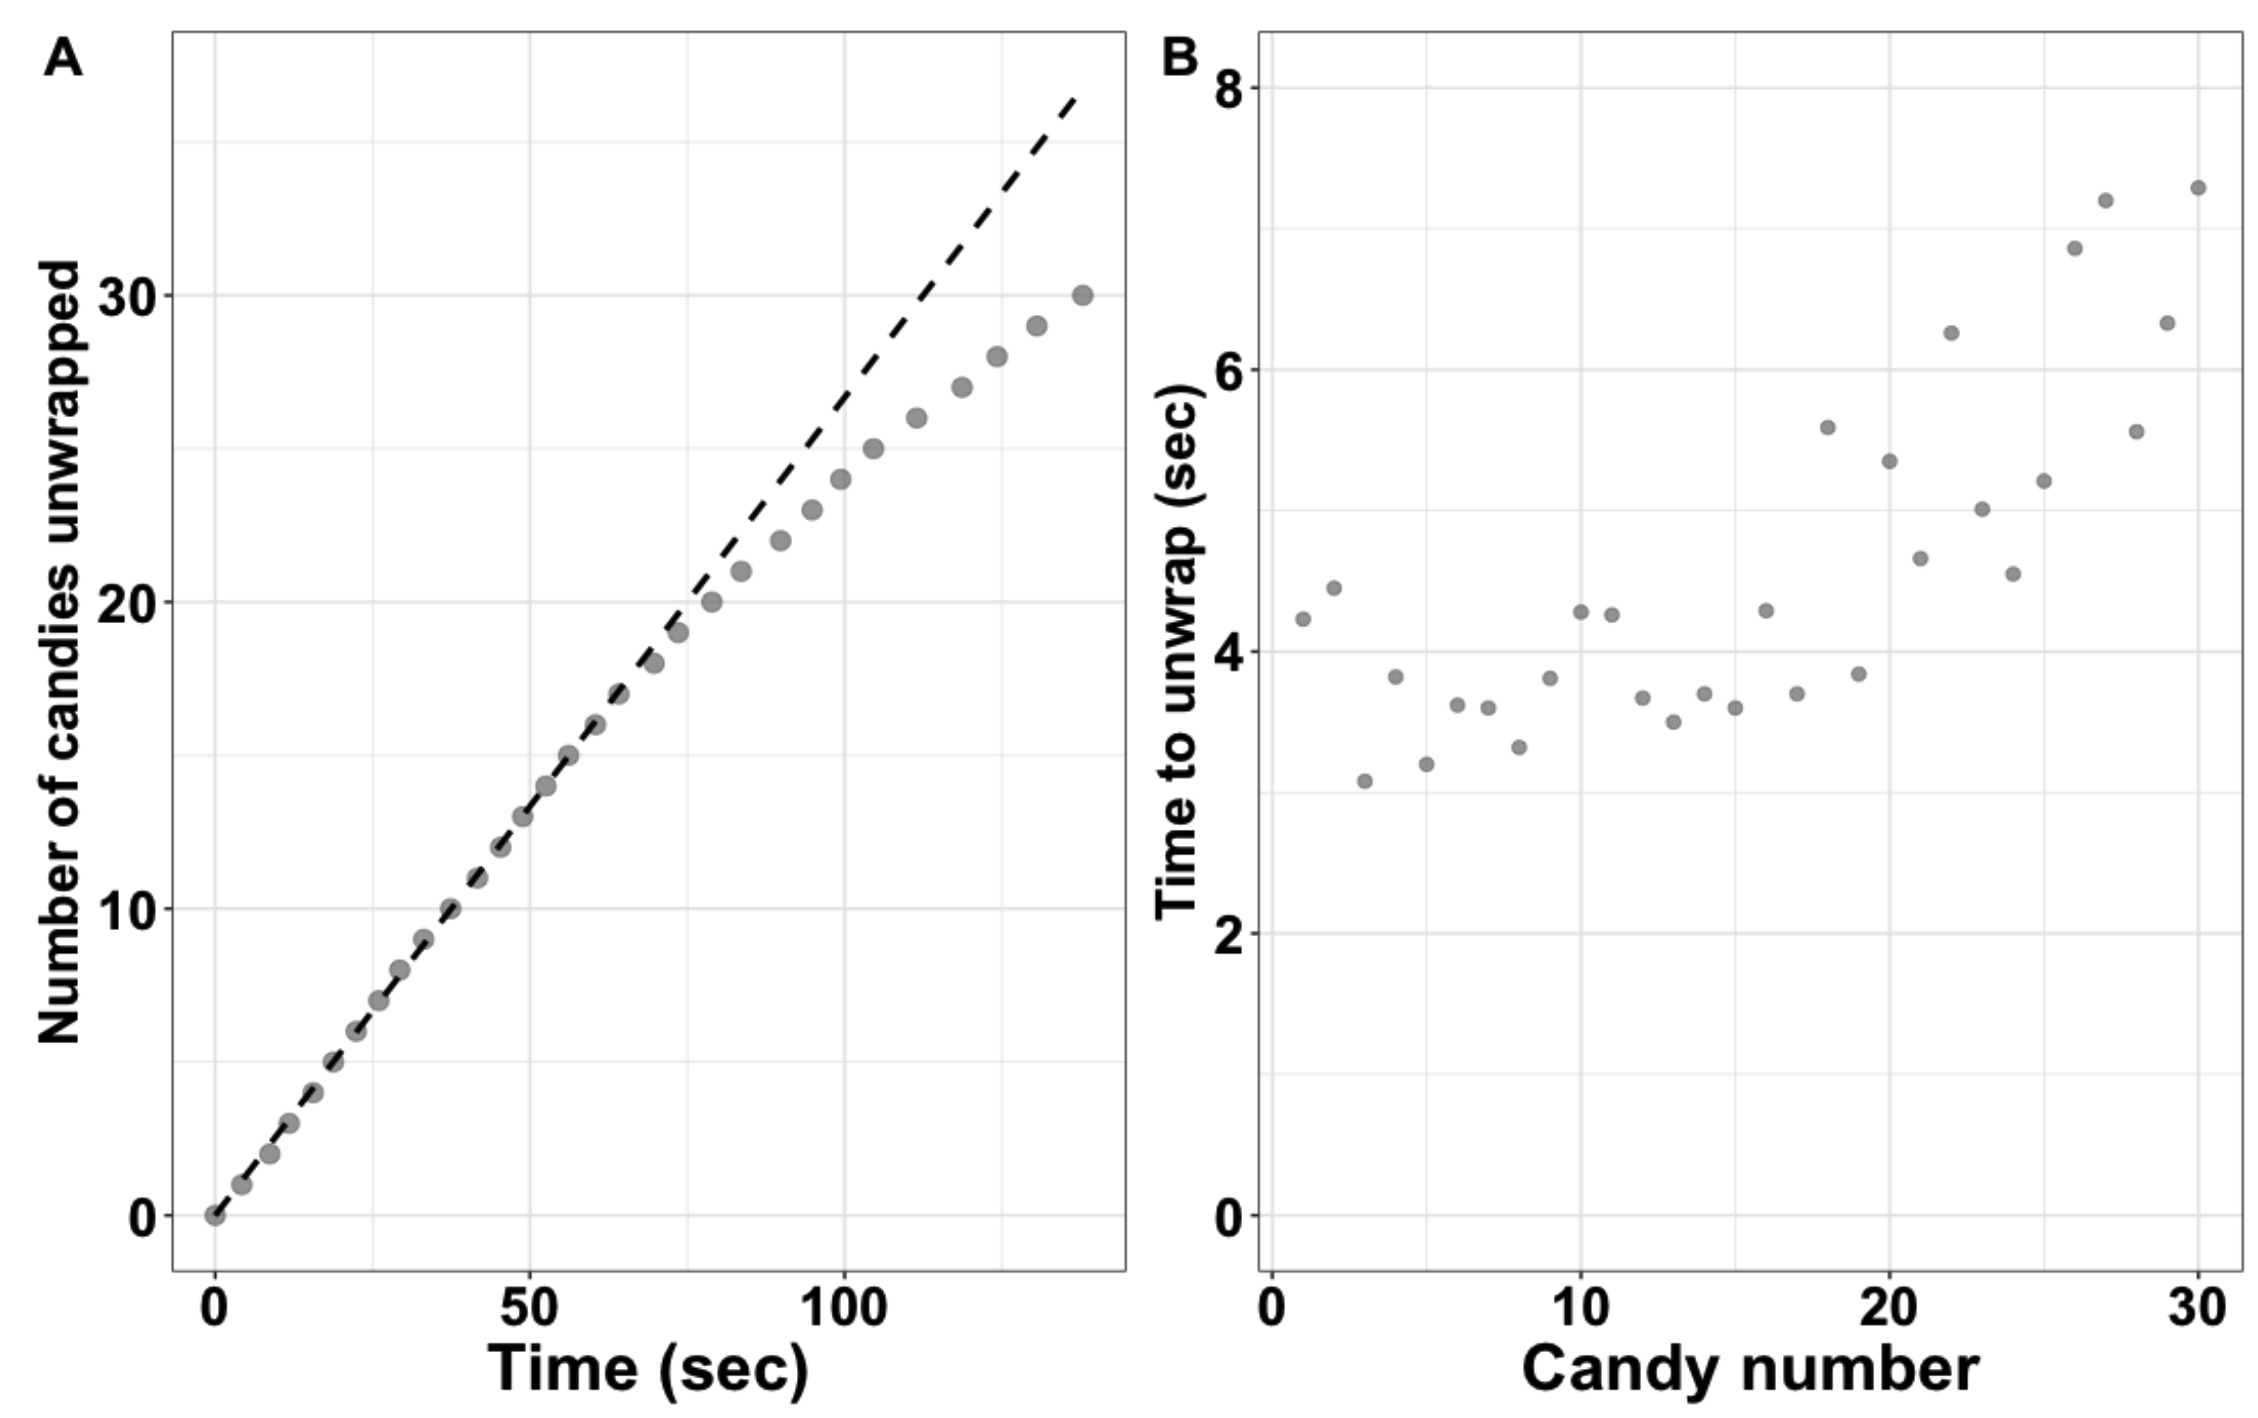
Figure 1. Example plots of data from the Initial Rates activity. (A) Plot of number of candies unwrapped over time collected on 30 Jolly Ranchers. This data set corresponds to the example data found online and the demonstration video. (B) Plot showing the time to unwrap for individual candies.
Optional Discussion
In addition to the activity above, we introduce in this session how to describe enzymes using the algebraic notation (E + S ➝ ES ➝ ES* ➝ EP ➝ E + P) and that enzymes increase reaction rates by lowering the activation energy required to reach the transition state. This can be a separate discussion depending on the length of the class.
Effect of Substrate Concentration on Enzyme Rates
Pre-class Preparation
The instructor should fill five containers with 10, 20, 50, 100, and 200 candies. Additionally, the instructor should create a spreadsheet for recording and plotting the data that is collected during the activity. A model spreadsheet can be found as Supporting File S3. Enzyme Kinetics - Kinetics Data Spreadsheet or at osf.io/58wtn/files/. Arrange the classroom so that students do not hurt themselves while searching for candies to be unwrapped. In our experience, students get competitive by the end of the demonstration as they try to unwrap the candies quickly; this is when you need to take care to ensure that accidents do not occur.
In-class
A detailed script for this lesson with question prompts is provided as Support File S2. Enzyme Kinetics - Instructor Guide for Michaelis-Menten Activity or osf.io/58wtn/files/ and summarized below. We start with a brief recap of the previous lesson and the role of enzymes as catalysts. A student, or a small number of students, then measure the minimum time needed to unwrap a candy when the candy is already in their hands and they do not have to search for it. This number will be used as the minimum unwrapping time (which will be linked to Vmax later). We point out that, in cells, enzymes have to collide with or bind the substrate before reacting and ask how this might change the reaction rate. We then select students to be "enzymes" and "scientists" to observe how adding the collision and binding aspects of the reaction may change the kinetics and how substrate concentration affects the kinetics. In the demonstration, the "scientists" will observe one of the "enzymes" and measure how long it takes that "enzyme" to find the candy and unwrap it. Once roles are assigned and described to the students, the "enzymes" are asked to leave the room and the instructor distributes the 10 candies around the room. The "scientists" begin their timers when the "enzymes" re-enter the classroom as a group and search for a candy to unwrap. When an "enzyme" unwraps a candy, the "scientist" stops the timer for that "enzyme" specifically. The demonstration continues until all "enzymes" unwrap the candy. The "scientists" report the times of each "enzyme" and the instructor (or a student) then records all the times in the spreadsheet and calculates the average unwrap time given the substrate concentration. The class is then asked whether the average value is the same as the minimum time measured earlier, which lacks the searching aspect. The demonstration is repeated, and the data recorded until all five concentrations of candy have been tested. By the end, the average unwrapping time at the highest concentration (200 candies) is usually two times as long as the previously determined minimum time needed to unwrap a candy.
Students are asked to clean up all candies and, while they are probably eating candies, the class converts the searching and unwrapping times to rates by dividing '1' by the unwrapping times at each concentration, respectively. Students then plot the data as directed in Handout 2 (Supporting File S4. Enzyme Kinetics - Michaelis-Menten Activity Sheet). In theory, students can do this independently, but in practice they get stuck and need guidance. We prefer to provide some guidance and proceed as a class through the steps of the calculations and plotting. Example data collected in class are shown in Figure 2. Next, the class estimates the kinetic values from both the Michaelis-Menten and Lineweaver-Burk plots. The Vmax estimate should be similar to the minimum unwrapping time measured at the beginning of class, which sometimes impresses the students. Additional whole-class discussions focus on what actions dominate at low concentrations of substrate (the time it takes to find/collide with the candy) versus high concentrations (unwrapping). To avoid lecturing, we encourage the students to describe what they observed while watching the enzymes at the different concentrations. Finally, we introduce students to their data fitting homework assignment and the resources they should consult to be successful in fitting those kinetics data.
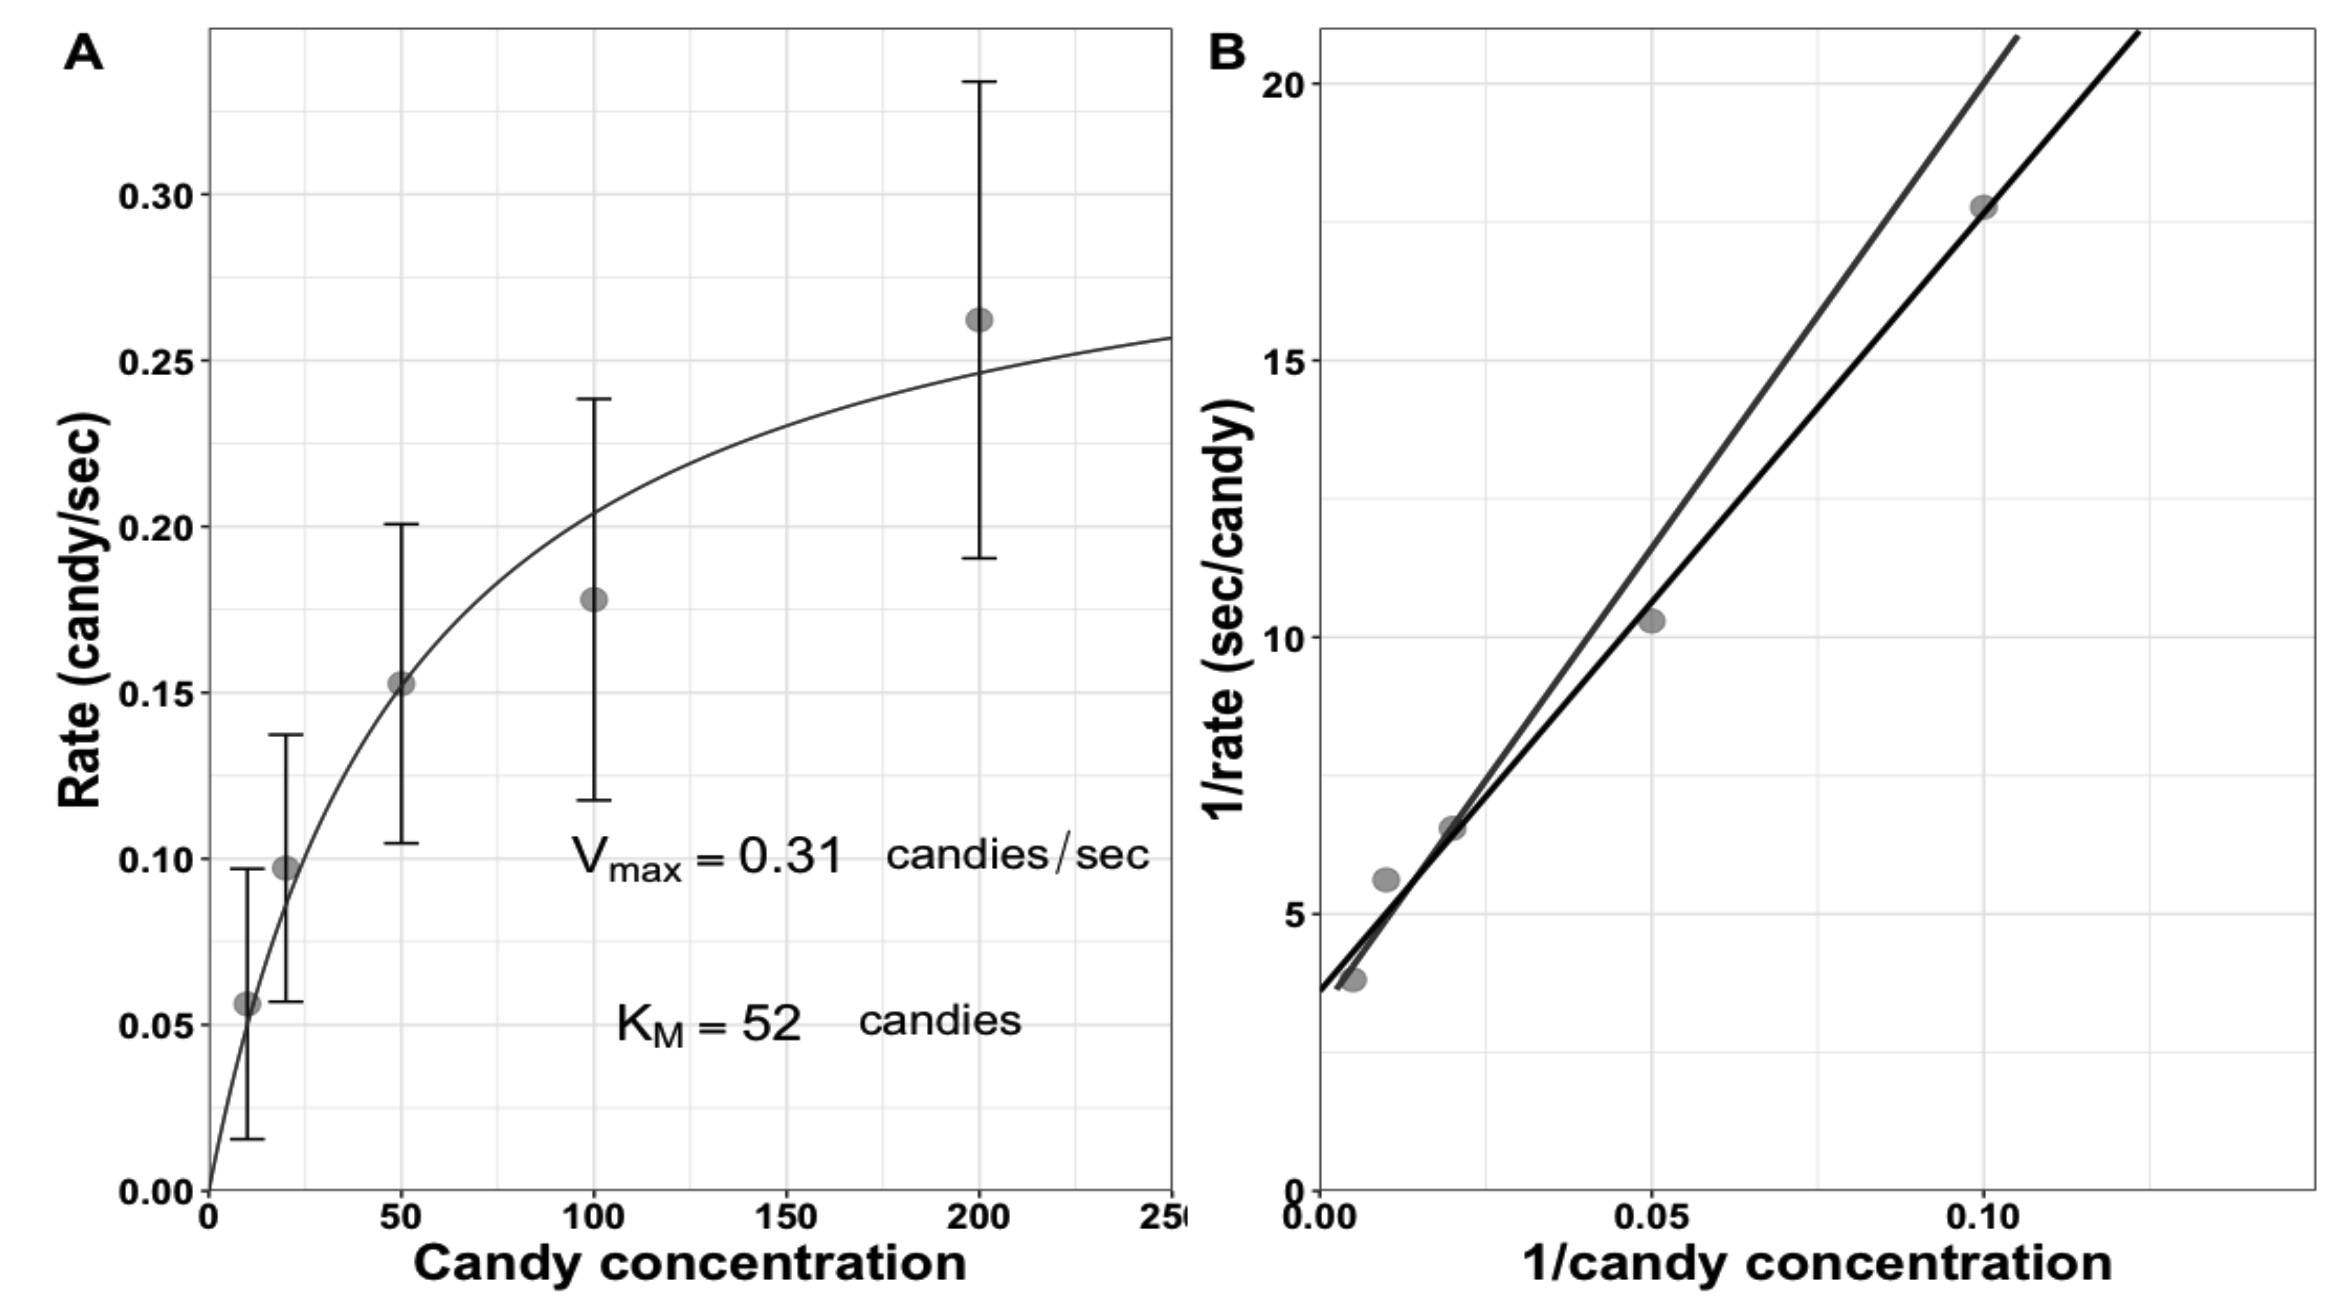
Figure 2. Example of saturation curve for student enzymes unwrapping candy. The calculated Vmax and KM values are shown. Error bars show standard deviation of student unwrapping times; however, students are not required to incorporate these into their plots.
Fitting Kinetic Data to Determine Vmax and KM
Pre-assignment Preparation
The instructor can make data from class available to students, although most students should have recorded the data in their handout. We provide our students with a Nature Protocols manuscript describing fitting enzyme kinetics data in Excel (10). Additionally, students are provided with websites that can walk them through the theory behind data fitting and provide a brief description of how to fit the data in Excel/Sheets (https://protocols.io/view/fitting-enzyme-kinetics-data-with-solver-bik7kczn.html). We distribute this information through the learning management system for the course.
Homework
Students work to fit the data using direct fitting and Lineweaver-Burk methods to validate their in-class estimates of the kinetic parameters. We give the students about one week to complete the assignment and try to have that time interval span at least one office hours session for students to come in and ask questions. Students frequently struggle with showing two data sets (raw and fitted) on the same plot and showing the fit appropriately. For a homework grade, we ask students to submit a write up of their fitting procedure and describe their data and results. Additionally, we ask them to compare the calculated kinetic values between the two fitting methods to illustrate the limitations of Lineweaver-Burk fitting (11). Students are also asked to connect the demonstration to enzyme behavior by explaining what Vmax and KM represent for biological catalysts.
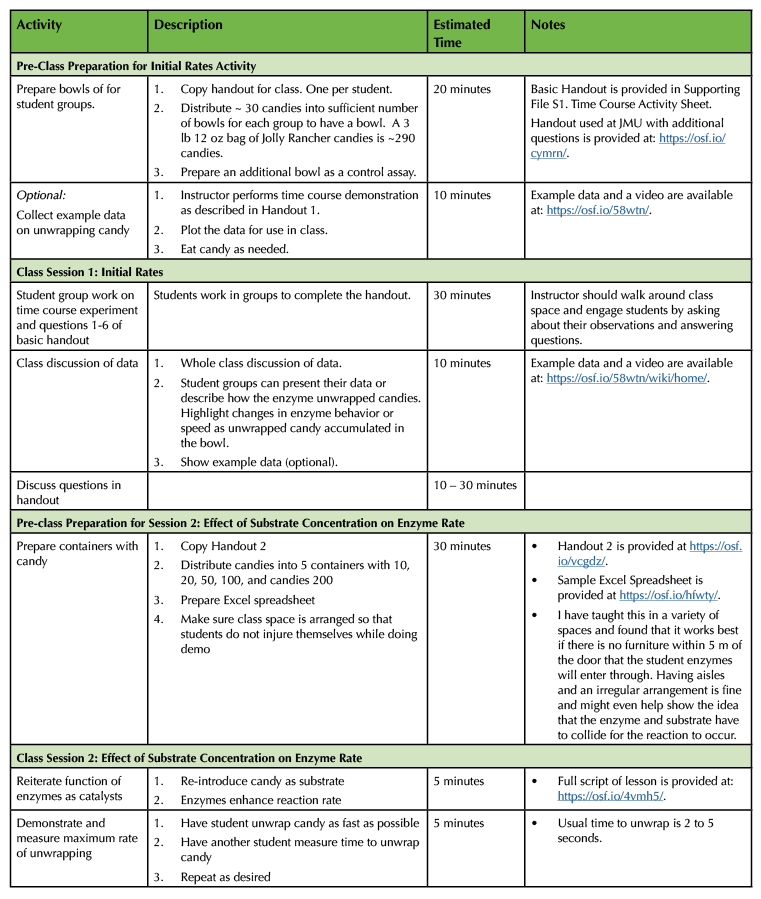
Table 1. Lesson plan and timeline for preparing and conducting enzyme kinetics lesson.
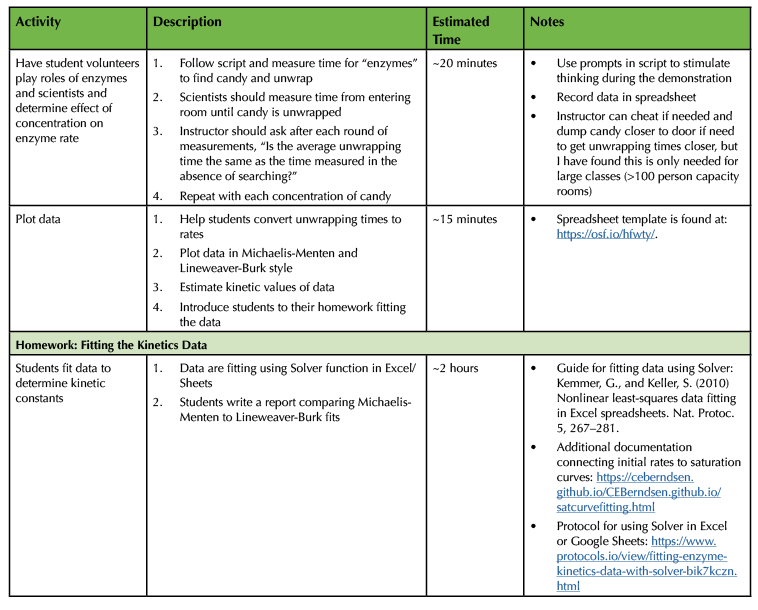
Table 1. Lesson plan and timeline for preparing and conducting enzyme kinetics lesson (continued)/
TEACHING DISCUSSION
Student Outcomes
We asked students to rate their confidence in analyzing enzyme kinetics data and calculating enzyme rates or kinetic parameters from data before and after doing this activity. The aggregated data from two semesters is shown in Figure 3 and indicates student confidence increased for the majority of students from feeling that they would need significant guidance to feeling more comfortable in their understanding of enzyme kinetics and the experiments involved. Students were also asked about their confidence in making figures of numerical data and showed increased confidence in this activity as well (Figure 3).
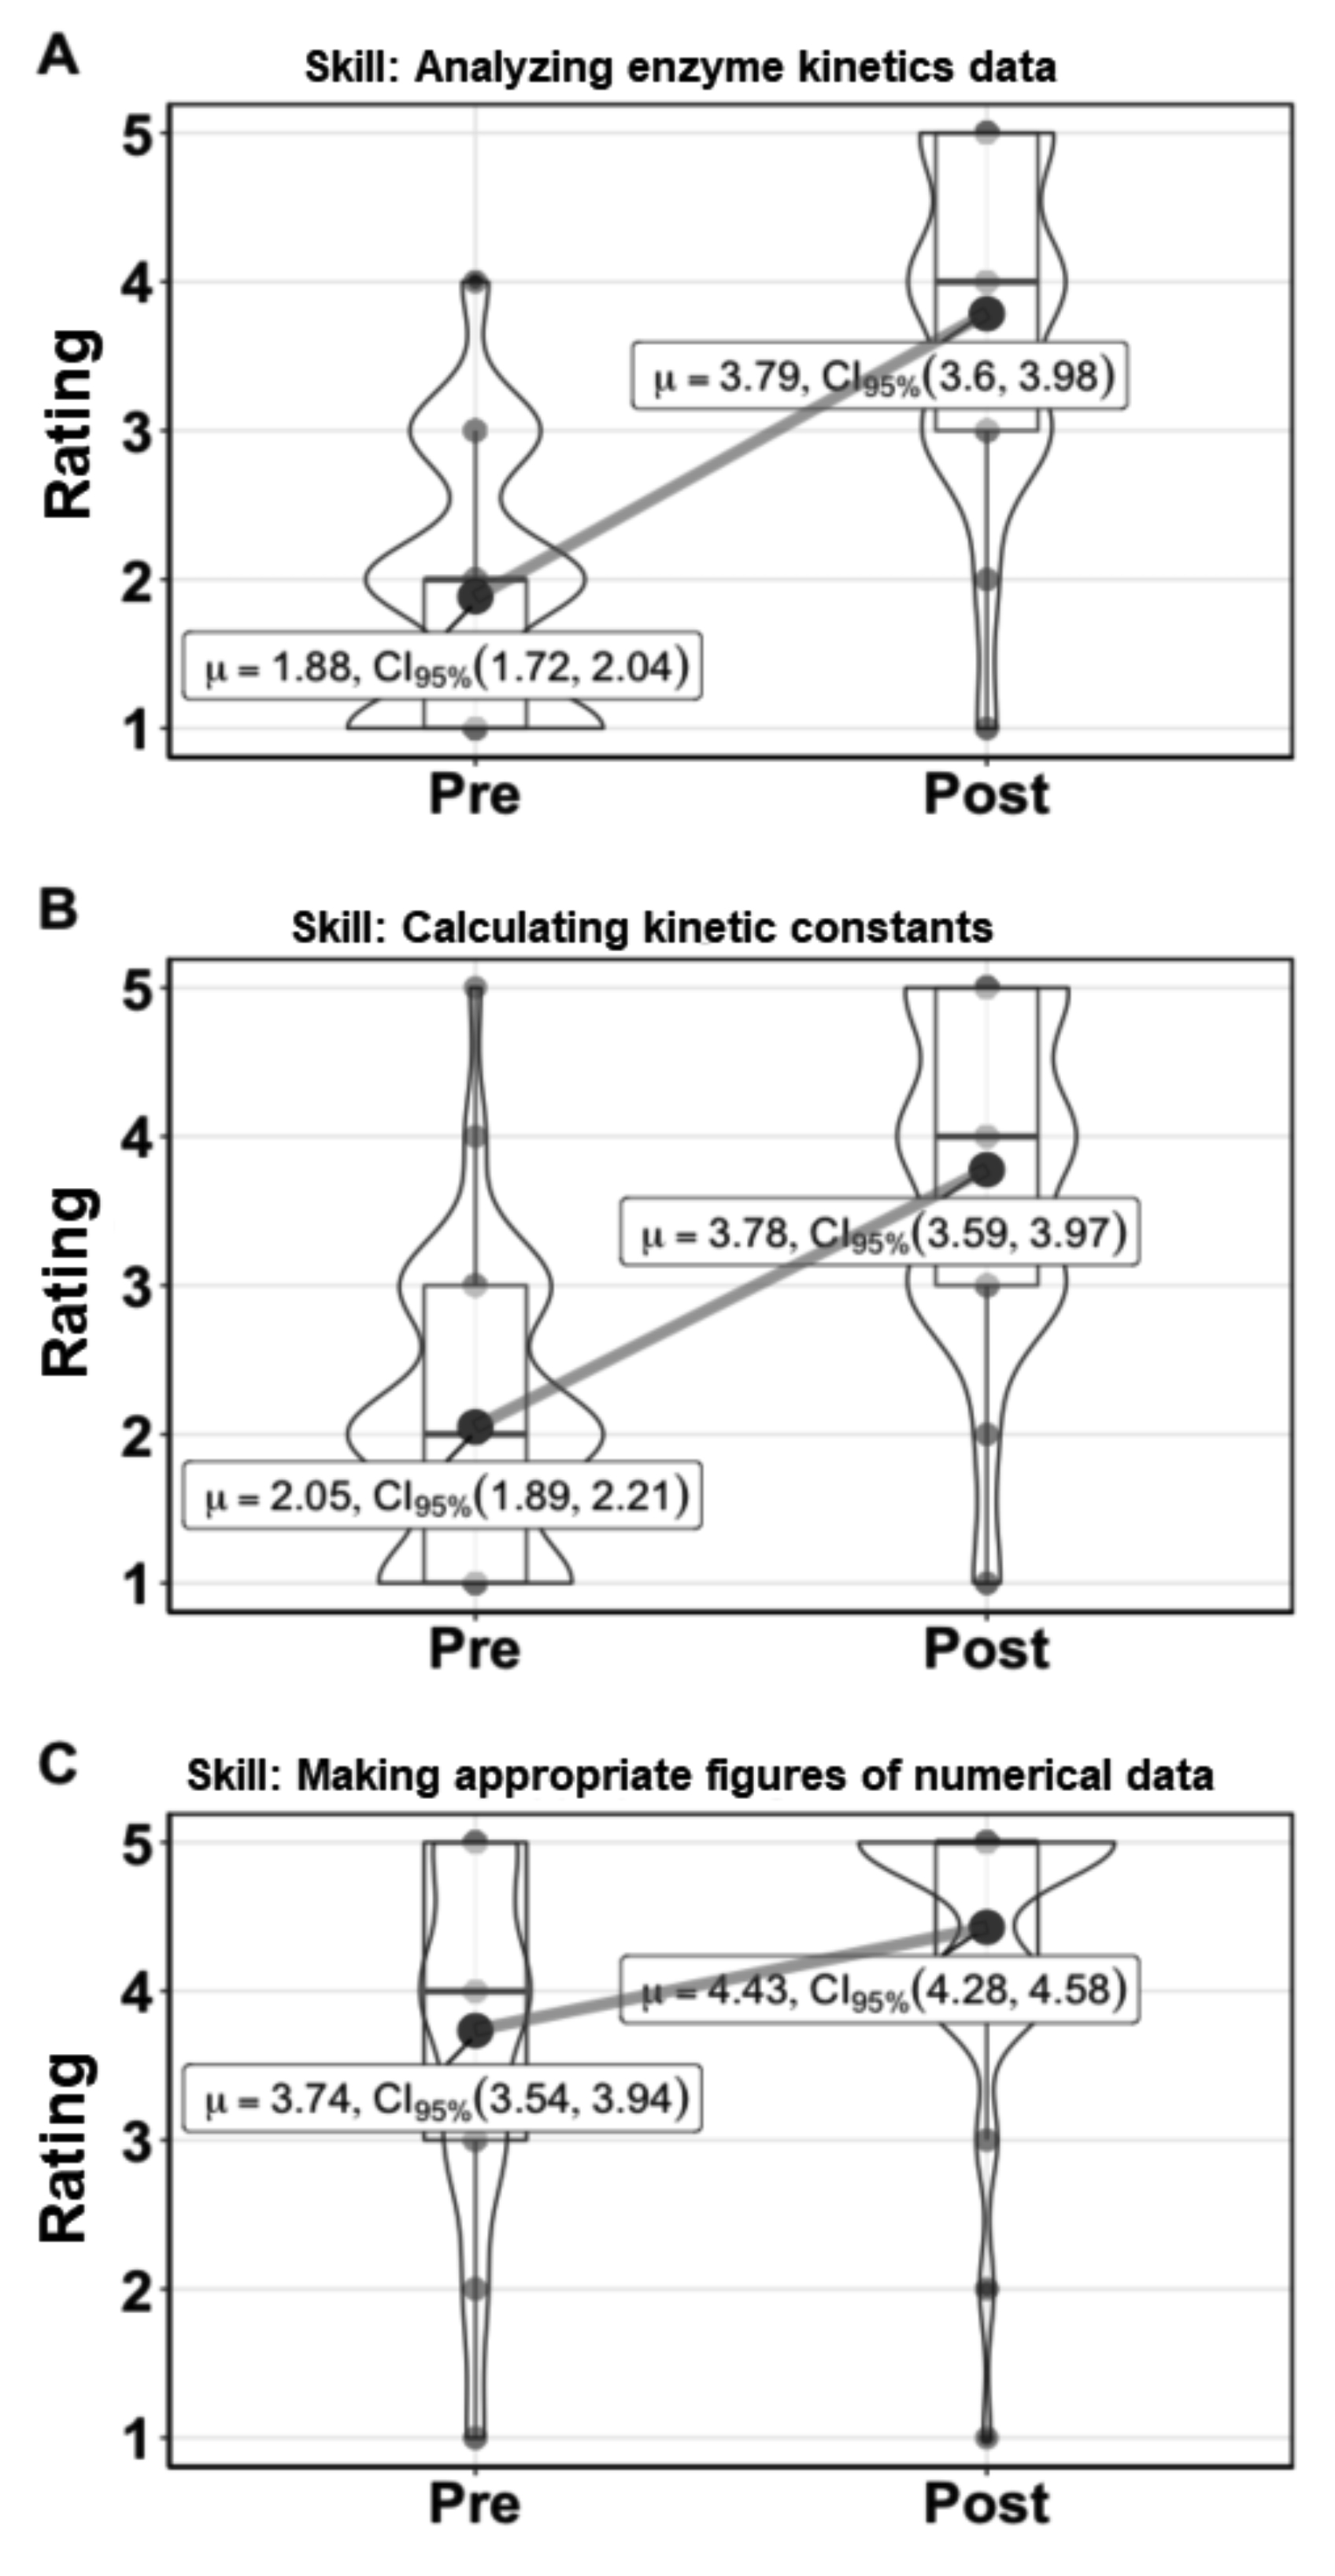
Figure 3. Kinetics lessons increase student confidence in analyzing and communicating enzyme kinetics data. Results from three student survey questions asking students anonymously to rank their confidence in performing a skill on the scale: 5 = Could perform the task with almost no supervision or guidance, 4 = Could perform the task with an instructor nearby but not in the same room, 3 = Could perform the task with an instructor in the room, but without constant input, 2 = Could perform the task with an instructor next to me and with constant input, 1 = Could perform the task with step-by-step guidance from the instructor. The number of responses recorded in the pre-survey was 123 and for the post-survey 121. µ is the mean value, CI95% is the 95% confidence interval for the value. The box encompasses the 25th to 75th percentile, with the whiskers showing 1.5 times the interquartile range. The “violin” shows the distribution of all the data.
Struggles in Fitting Data
A portion of students regularly show issues with showing the fit to the data correctly in Excel. How to show the data is explicitly discussed in the Kemmler and Keller paper (10); however, we typically receive a few homework assignments where the data are fit with a log/polynomial trendline. This line is easy to add using the Add Trendline command in Excel and appears to fit, which we believe confuses students. While it is easy to identify the error in the homework since the log trendline does not pass through the origin, getting students to understand the error is more difficult even when shown a proper fit alongside their fit. We believe this is a data and Excel literacy issue, which we are working to address by introducing small Excel-based assignments earlier in the course.
The Activity Overall
Broadly speaking, students are positive about performing these activities in part because they are highly interactive and there is candy provided, but also because they aid in their visualization of a previously unseen phenomenon. By "seeing enzymes" at sub-saturating and saturating concentrations of substrate and in the presence of product, enzyme behavior under these distinct conditions becomes clearer.
Extensions and Adaptions
These lessons can be extended to cover other topics including enzyme specificity, active site structure, and enzyme inhibition. We do not use these extensions as frequently because of the content constraints of teaching a one-semester survey course. However, brief outlines of how these variations work in class are described below.
Competitive Enzyme Inhibition
After performing the saturation experiment, introduce a second candy type as the inhibitor. We use Tootsie Rolls given their size and shape similarity to Jolly Ranchers. We give student groups both candies, and then have one student, who will be the "enzyme," close their eyes. The other students in the group place several Tootsie Rolls in front of the student and one Jolly Rancher. The student "enzyme" with eyes still closed, then is asked to unwrap the Jolly Rancher. This is repeated at increasing concentrations of Tootsie Rolls and the time to unwrap the Jolly Rancher is recorded. When there are lots of Tootsie Rolls present, it is harder to find the Jolly Rancher and only by increasing the concentration of substrate is inhibition able to be overcome.
Enzyme Specificity
Jolly Ranchers are produced in many flavors and students often prefer one flavor over another. While the overall shape of the candy is similar, flavor is a chemical property of the substrate that influences whether a particular student will unwrap and eat the candy. Like students, enzymes prefer specific but sometimes subtle features in their substrates. We then discuss that NADH and NAD+ or oxidized and reduced cytochromes or ubiquitin and ubiquitin-like molecules have similar shapes, but that other features can dictate whether an enzyme will act on the molecule.
Active Site Structure
Part of enzyme specificity is how well the molecule fits in the active site and aligns with the catalytic features. In groups, a student enzyme should unwrap a number of candies while the rest of the group observes the unwrapping. As a group, the students should describe how the unwrapping occurred and whether the enzyme consistently held the candy the same way while unwrapping. More often than not, students have a consistent method to unwrap the candies much like enzymes bind to substrates and catalyze the reaction the same way each time.
SUPPORTING MATERIALS
- S1. Enzyme Kinetics - Time Course Activity Sheet. Student activity sheet for Day 1 activity on initial rates
- S2. Enzyme Kinetics - Instructor Guide for Michaelis-Menten Activity. A guide to help instructors prepare and perform the activity including some prompts.
- S3. Enzyme Kinetics - Kinetics Data Spreadsheet. An .xlsx file for collecting data from the Michaelis-Menten kinetics activity.
- S4. Enzyme Kinetics - Michaelis-Menten Activity Sheet. Student activity sheet for Day 2 activity on the effect of substrate concentration on enzyme rate.
ACKNOWLEDGMENTS
The authors wish to thank the students in CHEM361 for their enthusiasm and participation in these activities. CEB wishes to thank Dr. John M. Denu at the University of Wisconsin-Madison for his initial inspiration of the saturation curve activity on which the authors built the present work. Research and teaching activities by the authors are supported by the Thomas and Kate F. Jeffress Memorial Trust, the National Science Foundation, and the 4-VA organization. The student assessment activities are monitored by IRB protocols 19-0070 and 20-1076.
References
- Johnson KA, Goody RS. 2011. The original Michaelis constant: Translation of the 1913 Michaelis-Menten paper. Biochemistry 50:8264-9.
- Michaelis L, Menten ML. 1913. Die kinetik der invertinwirkung: The kinetics of invertase action translated by R.S.Goody and K.A Johnson.
- Rodriguez JMG, Towns MH. 2019. Catalyzing student learning: Using analogies to teach enzyme kinetics. J Chem Educ 96:1401-1406.
- Gehret AU. 2017. Pop-it beads to introduce catalysis of reaction rate and substrate depletion effects. Biochem Mol Biol Educ 45:179-183.
- House C, Meades G, Linenberger KJ. 2016. Approaching a conceptual understanding of enzyme kinetics and inhibition: Development of an active learning inquiry activity for prehealth and nonscience majors. J Chem Educ 93:1397-1400.
- Hinckley G. 2012. A method for teaching enzyme kinetics to nonscience majors. J Chem Educ 89:1213-1214.
- Runge SW, Hill BJF, Moran WM, Turrens JF. 2006. A simple classroom teaching technique to help students understand Michaelis-Menten kinetics. CBE Life Sci Educ 5:348-52.
- Junker M. 2010. A hands-on classroom simulation to demonstrate concepts in enzyme kinetics. J Chem Educ 87:294-295.
- Pederson DM. 1974. Lecture demonstrations in kinetics relevant to the biology student. J Chem Educ 51:268.
- Kemmer G, Keller S. 2010. Nonlinear least-squares data fitting in Excel spreadsheets. Nat Protoc 5:267-81.
- Dowd JE, Riggs DS. 1965. A comparison of estimates of Michaelis-Menten kinetic constants from various linear transformations. J Biol Chem 240:863-9.
Article Files
Login to access supporting documents
Unwrapping Enzyme Kinetics(PDF | 399 KB)
S1. Enzyme Kinetics -Time Course Activity Sheet.docx(DOCX | 27 KB)
S2. Enzyme Kinetics - Instructor Guide for Michaelis-Menten Activity.docx(DOCX | 19 KB)
S3. Enzyme Kinetics-Kinetics Data Spreadsheet.xlsx(XLSX | 20 KB)
S4. Enzyme Kinetics - Michaelis-Menten Activity Sheet.pdf(PDF | 165 KB)
- License terms

Comments
Comments
There are no comments on this resource.