Vocabulary for the Scale Parameters
Common English Uses of the Word Spread
Did you know...?
The Oxford English Dictionary provides more than 25 definitions for the word spread including a coverlet, banquet, any substance suitable for putting on bread, an advertisement displayed prominently in a newspaper or periodical, to unfold or expand, an expanse or stretch of something, and paunchiness.
Spread can be used as a noun, an adjective, and both a transitive and intransitive verb.
Said the statistician from west Texas:
Howdy! Welcome to my spread and make yourself at home. Go ahead and spread out your papers and help yourself to all the food – it’s quite a spread, huh? Be sure to try some of that blueberry spread; just spread a little on a cracker. Yum! And take a look at that fancy tablecloth; my grandma made that spread for me. Once you’re all settled in we’ll open up that spreadsheet and see if we can’t figure out the spread of those data.
Research on Student Learning in Statistics Associated with the Use of the Word Spread
Did you know....?
Before a statistics course, when asked to define the word spread student responses covered a range of 10 different definitions, the most common of which were
- to cover evenly or in a thin layer (34%)
- to scatter, disperse or extend over a larger area (32.5%)
- a range between numbers or a point spread (12%)
Other responses were a large group, a spread sheet or graph, a jam, butter or dip, to open, as wings, to lay out in an orderly fashion, a vast area and to cover with a blanket or sheet.
After a statistics class, when students are asked to provide the statistical meaning for spread the most common definitions given are:
- definitions relating to dispersion (31%),
- definitions relating to the distribution or layout of the data (32%) and
- definitions relating to spreadsheets (21%).
The data suggest that nearly one-third of students process the word spread to mean how the data look or are laid out when graphed rather than as a measure of the relative distance of the data from the center. Furthermore, two-third of those students who do invoke a meaning of spread that is related to dispersion do so by giving range as a synonym for spread.
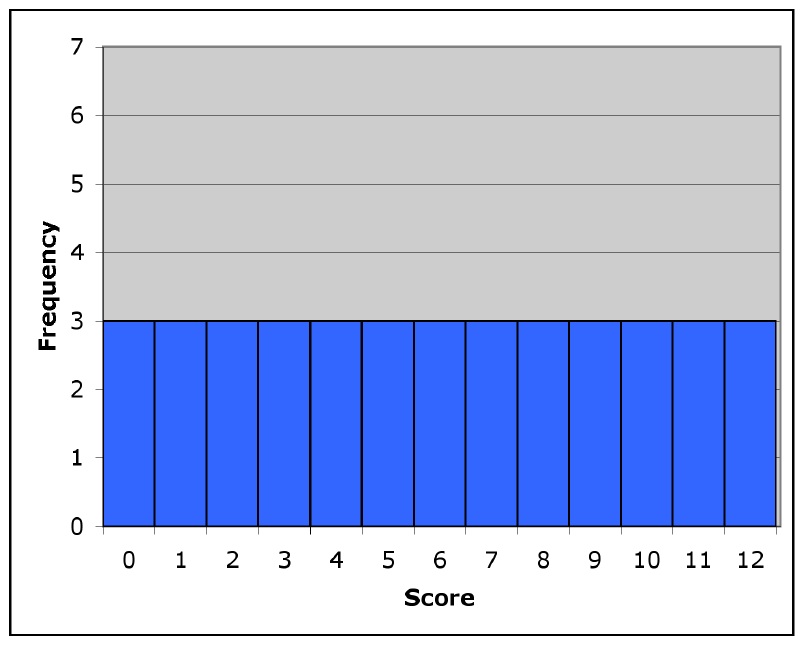
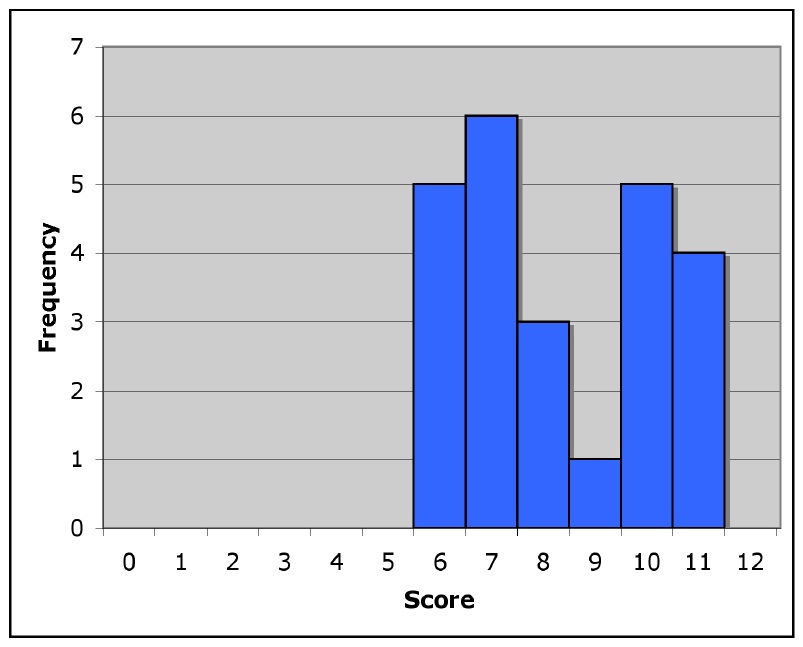
Students tend to label histograms with more uniform bar heights (Figure 1) as having less spread than those with irregular bar heights, but smaller range (Figure 2). This may be due to the definition of spread as "covering in a thin, even layer," leading students to consider the heights of the bars rather than the horizontal distance of the bars from the center of the distribution.

|

|
|
Figure 1: Histogram with large range and uniform bar heights |
Figure 2: Histogram with small range and irregular bar heights |
Suggestions for Instruction
Use the word variability as the primary or introductory word for measures of dispersion. Allow students to invent their own terms, such as spread, once they have demonstrated understanding of the concept of variability.
Rationale:
Dispersion, while capturing the essence of spread that is intended, may be too closely related to the definitional categories related to laying out, both in the colloquial sense of laying out cards or organizing study materials or in the visual layout of data. Dispersion, therefore, may conjure up two and three dimensional images for students, which are well suited to describing two variable plots, such as scatter plots, but inappropriate for describing plots of one variable, such as histograms.
Scale parameter is not an obvious choice as a replacement for spread. There is, however, some precedent for its consideration. First, it is one of the technical terms used by statisticians to describe variability (see for example, Casella & Berger, 2002). The argument against scale parameter is that it may be too technical and may confuse students because of the use of parameter, a word for which there is anecdotal evidence to indicate is difficult for students. Furthermore, the use of technical language that is unfamiliar to the student portrays a subject as more difficult than it is (Lemke 1990) so incorporating parameter into discussions of variability may create even more difficulty for students than spread.
While variability may be close to the words variable and variance, it strikes a balance between being neither too familiar nor too technical a word to describe the concept it describes. Quantification of variability is central to the study of statistics, but developing student understanding of and reasoning about variability is not an easy task (Reading & Shaughnessy, 2004). The use of variability, which is somewhat technical, lends an air of importance that is necessary to help students understand that variability is not a trivial concept. In this case, using a lesser-known word maybe help to cue students that the concept it represents is something on which they need to focus and work to understand.
Further Reading
Rangecroft, M. (2002).The Language of Statistics. Teaching Statistics, 24(2), 34 – 37.
