Each Community Spotlight features an outstanding group, partner, resource, or member of our community.

Working with Datasets in R swirl

By Caitlin Hicks Pries

air temp and precipitation data image


Module Description:

This resource is an activity designed to be completed in swirl, an interactive platform for learning and teaching R in the RStudio console.  Instructors can learn more about swirl and how to implement a swirl lesson here.  Students can complete swirl lessons using RStudio Cloud directly in their browsers - no software installation required.  

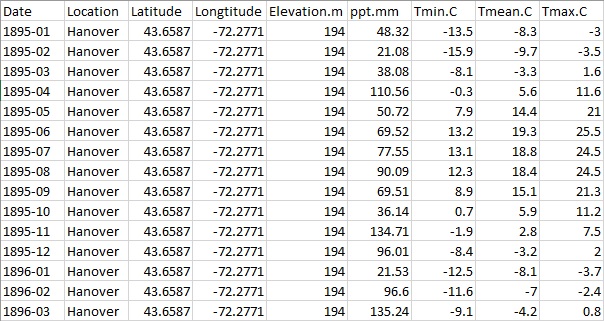
This lesson is part of a Global Change Biology course where one of the main learning objectives is to have the students develop and answer scientific questions by using R to access, organize, and graph actual long-term data sets. In order to explore global change data and learn how various anthropomorphic activities are affecting ecosystems and species, we need to import datasets into R and make sure all the variables are in the correct format that will allow us to perform data visualization (aka, create graphs). In this lesson, we will learn how to import data into R, perform basic QA/QC (quality assurance/quality control) of the data, and create some basic exploratory graphs of the data from which we can begin to answer scientific questions. We will be working with a dataset from the PRISM Climate Group (http://www.prism.oregonstate.edu/) that includes air temperature and precipitation over the past one hundred years in two towns in the United States (Boulder, CO and Hanover, NH). This resource also includes a graphing homework assignment and key that can be used as an assessment and extension of learning after students complete the swirl lesson.


Teaching Setting:

This 1-hour lesson was designed for an intermediate level Climate Change Biology course for majors.


Citation:

Pries, C. H. (2019). Working with Datasets in R swirl. Make Teaching with R in Undergraduate Biology Less Excruciating, QUBES Educational Resources. doi:10.25334/Q4KF2V


Visit Resource


Share
Tweet


Related Materials and Opportunities:

The author created this resource while participating in the Spring 2019 Make Teaching with R in Undergraduate Biology Less Excruciating (Make TRUBLE) Faculty Mentoring Network (FMN).  In this FMN, participants focused on developing, implementing, and sharing modules for teaching statistical and biological concepts in R with swirl, an interactive platform for learning and teaching R in the RStudio console. swirl lessons simplify the R learning process by providing a guided, interactive experience through on-screen prompts and exercises which students answer directly in R. swirl lessons can incorporate diverse biological datasets and can be used to seamlessly integrate learning of biology content, programming, and data analysis. The associated swirlify package features a user-friendly shiny app for developing custom lessons. 

Be sure to check out the other resources created by participants in the Make TRUBLE FMN including "Population Demography in Swirl" and "Importing Data into R" and check back on the Make TRUBLE FMN page where additional FMN products will be archived.  For even more swirl resources, browse the swirl lessons developed during the Fall 2018 Reducing Barriers to Teaching with R in Undergraduate Biology FMN, one of which was previously featured as a Resource of the Week

If you are interested in developing, implementing, and sharing modules for teaching statistical and biological concepts in R with swirl, then apply by August 16, 2019 to participate in the Fall 2019 Teaching with R in Undergraduate Biology FMN.  This is one of several FMNs QUBES is offering during the Fall 2019 semester.  Other Fall 2019 FMNs include:

Learn more about FMNs and browse all upcoming FMNs.

The PRISM Climate Group data used in this resource includes climate data for the contiguous United States; therefore, this resource could be adapted to use data from the location of your school.  If you do adapt this resource, you are encouraged to share your resource on QUBES.  When you do so, your resource receives a stable digital object identifier (DOI) and you can track the views, downloads, and adaptations of your resource.  Learn more about Open Education Resources on QUBES.   


QUBES on Social Media
BioQUEST is a transformative, collaborative community empowering educators to drive innovation in STEM education for all students.
Copyright © 2024 QUBES, All rights reserved.
P.O. Box 1452, Raymond, NH 03077
You are receiving this email because you have shown interest in receiving updates from BioQUEST and QUBES.

Subscribe / Unsubscribe from mailing list
View Community Spotlight on QUBESHub
Community Spotlight: Issue 44