Thinking deeply about quantitative analysis: Building a Biologist's Toolkit
Published online:
Abstract
Vision and Change in Undergraduate Biology Education encouraged faculty to focus on core concepts and competencies in undergraduate curriculum. We created a sophomore-level course, Biologists' Toolkit, to focus on the competencies of quantitative reasoning and scientific communication. We introduce students to the statistical analysis of data using the open source statistical language and environment, R and R Studio, in the first two-thirds of the course. During this time the students learn to write basic computer commands to input data and conduct common statistical analysis. The students also learn to graphically represent their data using R. In a final project, we assign students unique data sets that require them to develop a hypothesis that can be explored with the data, analyze and graph the data, search literature related to their data set, and write a report that emulates a scientific paper. The final report includes publication quality graphs and proper reporting of data and statistical results. At the end of the course students reported greater confidence in their ability to read and make graphs, analyze data, and develop hypotheses. Although programming in R has a steep learning curve, we found that students who learned programming in R developed a robust strategy for data analyses and they retained and successfully applied those skills in other courses during their junior and senior years.
Citation
Bray, S.R., Duffin, P.M., and Wagner, J.D. 2016. Thinking deeply about quantitative analysis: Building a Biologist’s Toolkit. CourseSource. https://doi.org/10.24918/cs.2016.4Article Context
Course
Article Type
Course Level
Bloom's Cognitive Level
Vision and Change Core Competencies
Class Type
Class Size
Audience
Lesson Length
Pedagogical Approaches
Principles of How People Learn
Assessment Type
INTRODUCTION
In 2009, the American Association for the Advancement of Science and the National Science Foundation released their call to action report called Vision and Change (1) that recommended major changes in undergraduate biology education to reflect the changes in how advances in biology science occur in the 21st century. The authors of the report note "To contribute effectively to this "New Biology" (NRC, 2009), scientists need to interact with information in new ways, including being able to manage large, complex data sets. Systems approaches and biological modeling rely on the application of mathematics and statistical analysis, while the explosive generation of larger and larger data sets demands increasingly sophisticated computational knowledge." In response to this report, we reevaluated our own biology curriculum (S1: TU Curriculum) and dramatically changed the way we teach our introductory courses to emphasize the process and data of biology research more and the facts of biology less (2).
Like most biology major curriculums across the country, however, we were outsourcing the quantitative competency training of our majors through a required course in calculus or statistics (3). Consequently, our students lacked the skills identified in the Vision and Change report: "Students also should be competent in communication and collaboration, as well as have a certain level of quantitative competency, and a basic ability to understand and interpret data. These concepts and competencies should be woven into the curriculum and reinforced throughout all undergraduate biology coursework". In response to this realization, we created a course called Biologist's Toolkit to train our majors and minors in skills in data analysis, data interpretation, and data presentation. These skills not only help them to succeed in our upper-level courses, but also in their careers as biologists after graduation.
Our Biologist's Toolkit course is only a 2 credit-hour course, but it has been greatly effective in improving quantitative competency and confidence in our students. Toolkit was designed for sophomores who have completed at least 1 semester of a 2-semester introductory biology sequence (S1: TU Curriculum). The class meets twice a week; once for 50 minutes in a lecture setting with approximately 30 students. The class is then divided in half and meets separately in a workshop setting for an additional 50 minutes where they collaboratively work on new data analysis problems. We propose that biology programs consider the value of their own Biologist's Toolkit course to strengthen skills they find lacking in their graduating seniors.
Here, we describe our efforts and outcomes that demonstrate increased student confidence in production and understanding of graphs, statistical analysis, and developing hypotheses. Furthermore, we report that students use these skills, specifically the ability to write R Studio code, to analyze and graph data generated in laboratory exercises and projects, in upper-level courses. Our experiences show the benefits of integrating these skills across the curriculum and serve as a model for implementation of Vision and Change's goals of communication and quantitative literacy.
DESIGN OF THE BIOLOGIST'S TOOLKIT COURSE
Biologist's Toolkit seeks to inculcate skills that students will use throughout their collegiate and biological career, including analysis and presentation of data, searching and reading primary literature, and communication of science. Although students begin developing some basic spreadsheet and graphing skills in the first-year curriculum, we designed this course as an intensive immersion in quantitative literacy to prepare them for continued development and more independent work in their upper-level courses. To that end, we spend nine weeks of a fourteen-week term teaching basic statistics and graphing using the open-source statistical programing language, R. R offers many advantages for teaching quantitative skills: 1) it is freely available; 2) it runs on nearly all operating system platforms; 3) it is increasingly used by practicing natural and social scientists (4); and 4) we believe the process of coding analyses makes students think more deeply about how they are analyzing data than commercial statistical programs with graphical user interfaces (5,6).
The majority of the semester is spent teaching quantitative and graphing skills in the R environment. We establish a course rhythm wherein the first day of the week is lecture-based with approximately 30 students and the second meeting is workshop-based with the class divided between two sections. We spend the first two weeks using RStudio Desktop to explore data and build a basic understanding of folder and directory structures, file and data management, and basics of script writing and annotating code. In the next six weeks, we introduce a new statistical approach at the first course meeting each week (S2: Syllabus for Biologist's Toolkit, see schedule at the end of the document). After providing background about the underlying theory and assumptions of a particular statistical approach, we hand out example code and go through the code as students annotate their copy (Figure 1).
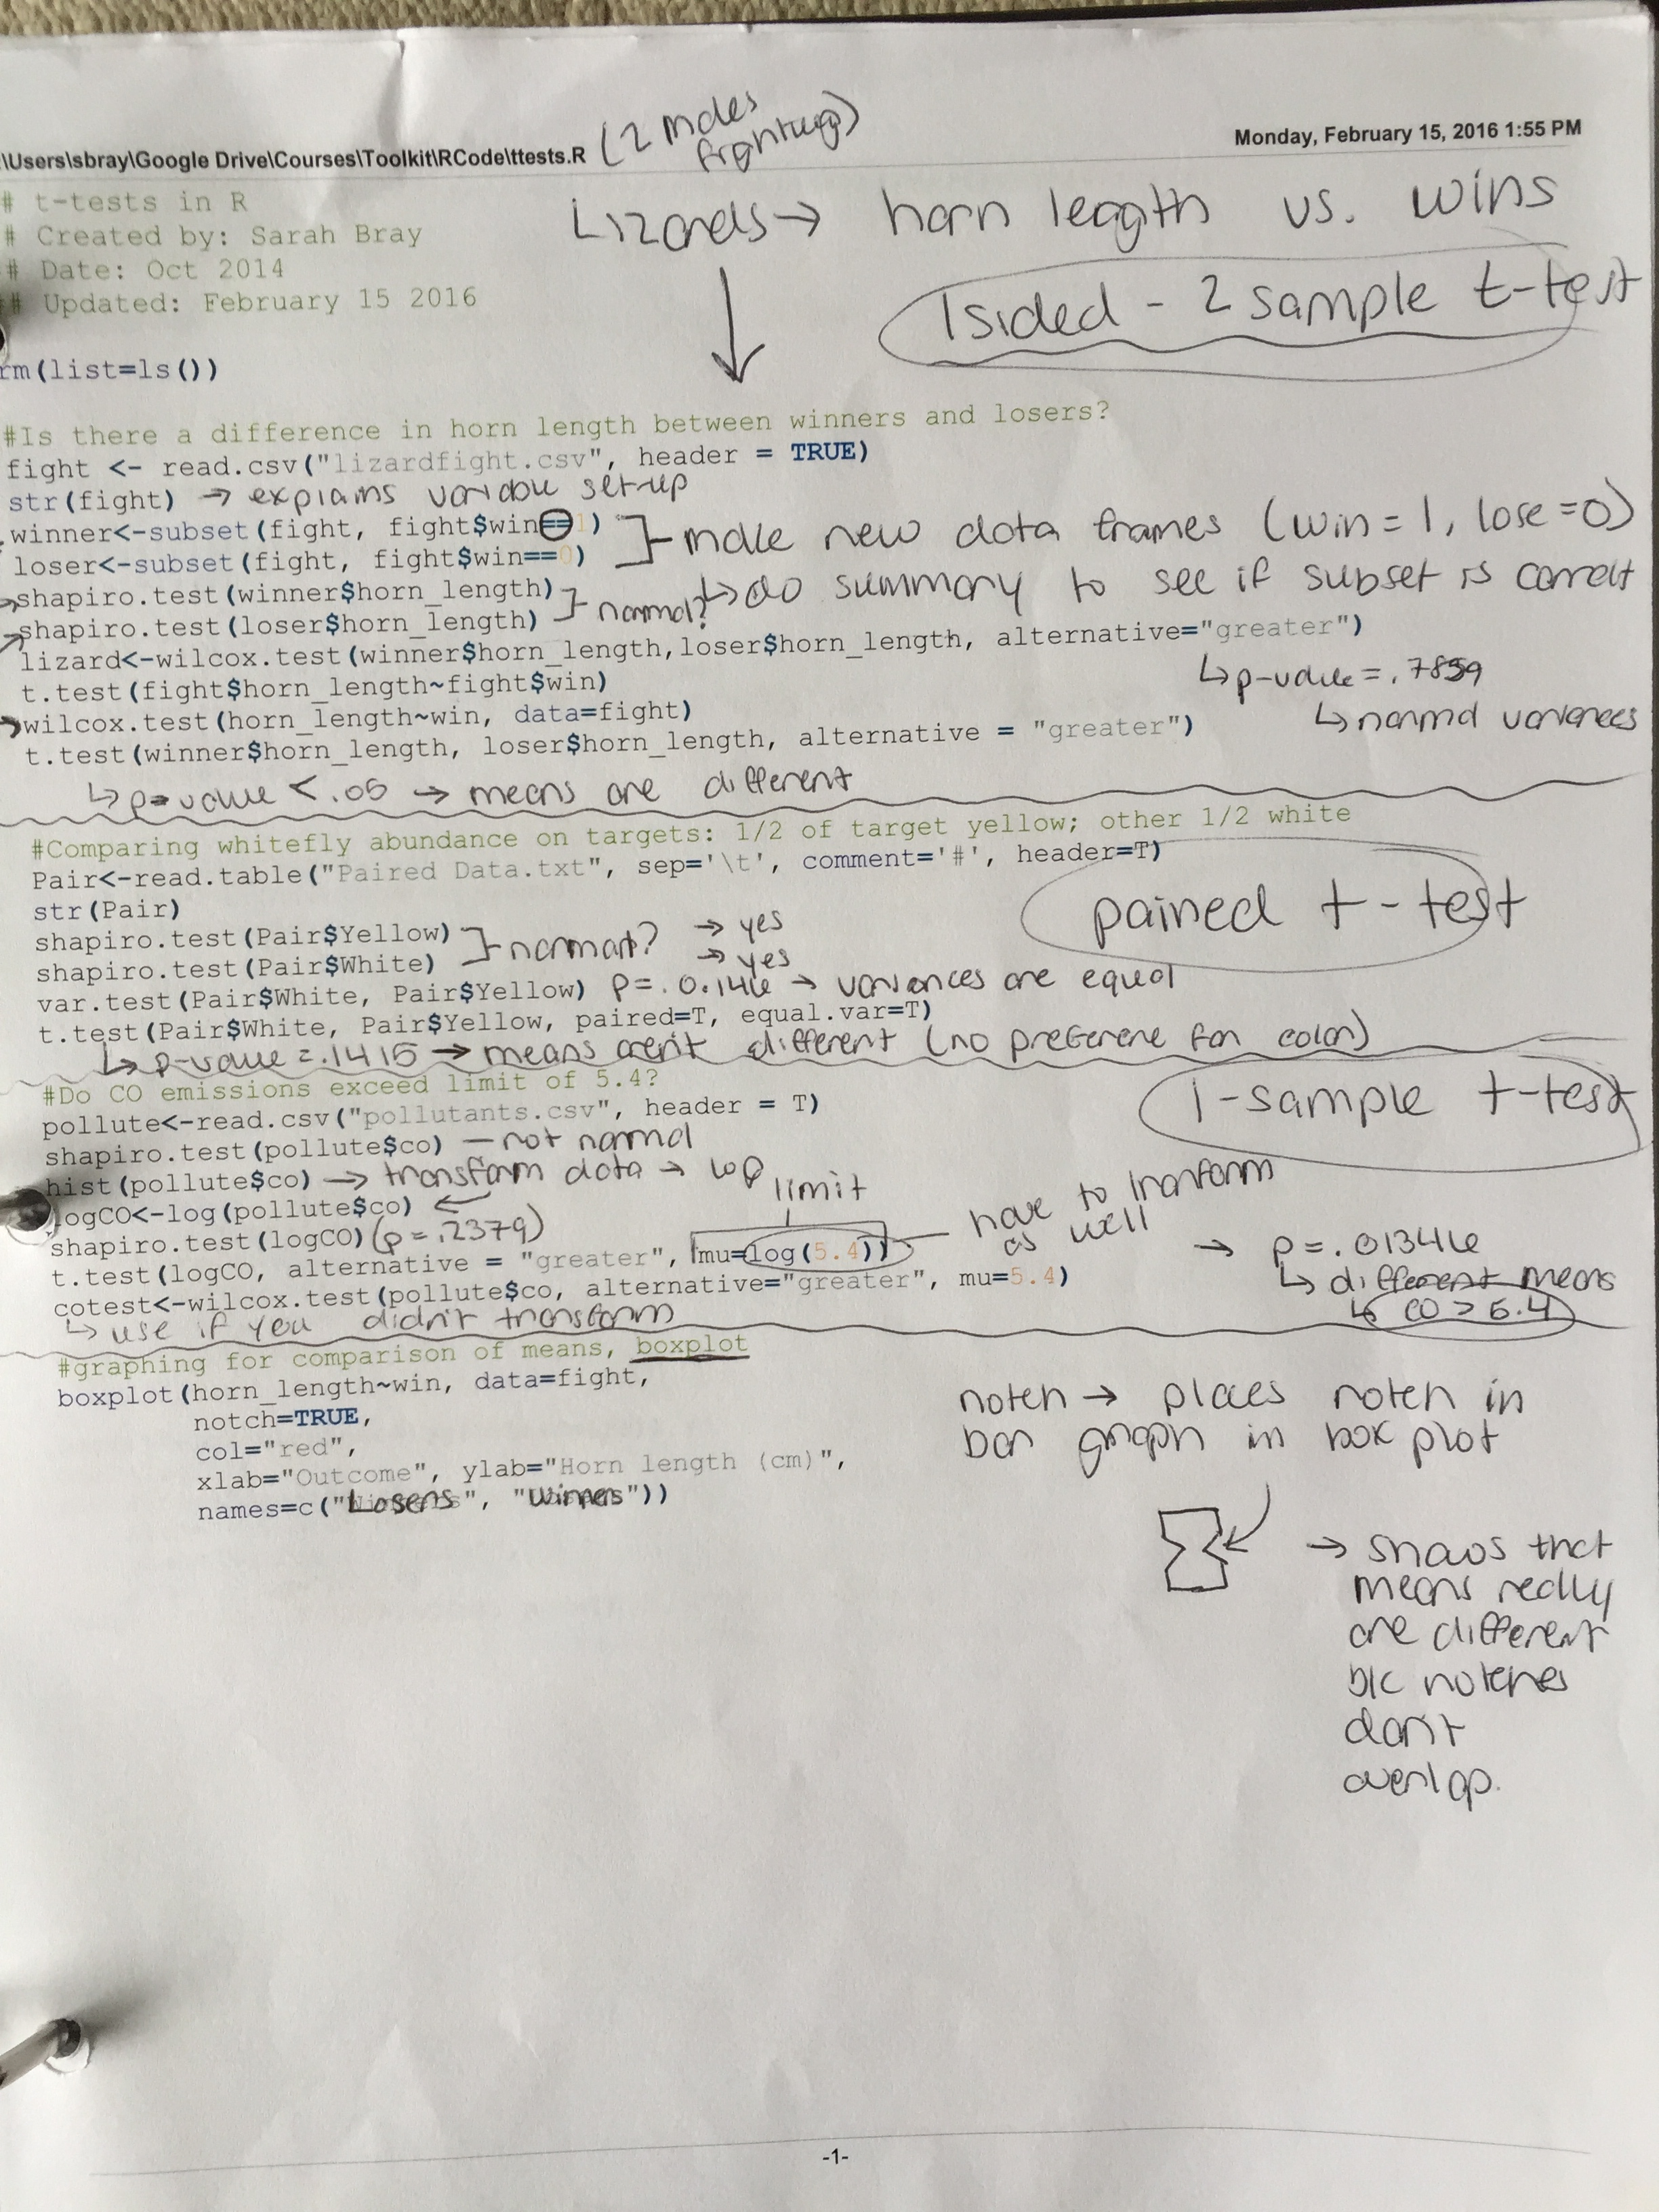
Figure 1: Example of R code annotated by a student.
Students cited going through code examples as the most useful approach to learning R (Figure 2). For the second course meeting of the week, we divide the class into two workshop sessions during which students work on their own laptops, using RStudio to apply that week's statistical approach to analyze and graph a new data set. We have used a diversity of data sets such as those included in the R package datasets (7), provided by the author of the textbook we use (8), and data from our own projects or previous lab courses. In the workshop sessions, students are encouraged to help one another troubleshoot (e.g. using Help in RStudio, searching for error outputs, referencing their notebook or textbook, etc.) and we often encourage students using the same operating platform to sit together. The instructor and a teaching assistant (an undergraduate student who has previously excelled in the course) also float around the room to help guide students toward specific resources that will help them troubleshoot. Although students are encouraged to work together to solve coding problems, students are individually assessed via a one-page homework assignment. Homework assignments generally require a graph and a short paragraph describing the results and interpreting the statistical analysis (S3: Homework Example). Completing and receiving feedback on homework were cited as the second and third most helpful resources in learning R (Figure 2).
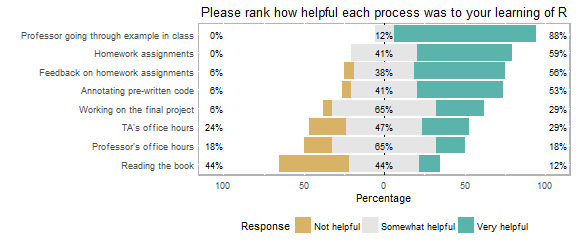
Figure 2. Winter 2016 post-term student responses to the question, “Please rank how helpful each process was to your learning of R?”
One of the most important components of the course, we have found, is the notebook that we require each student to keep. In the notebook, students keep class notes, annotated handouts, homework, and printouts of the highly annotated scripts they create (S4: Student Script). This notebook serves as a reference during the course. Students can earn back points they lost on homework by responding to feedback in their notebooks and consult them heavily during the final project (see below). At the end of the semester, students cited their notebook as their most consulted resource (Figure 3). We feel the greatest asset of notebooks, however, is that students refer back to their notebooks as they continue to analyze and present data in upper-level courses (see Curricular Challenges, below).
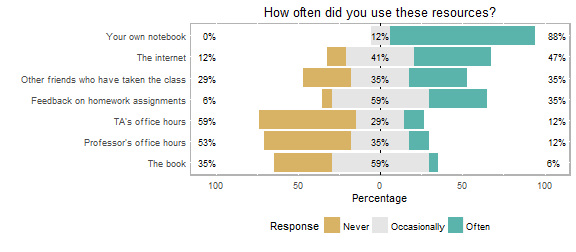
Figure 3. Winter 2016 post-term student responses to the question, “How often did you use these resources?”
For the final assignment in the course (S5: Final Project Description), each student is presented with a unique data set and some basic information about how the data were collected. Students develop at least two hypotheses that can be explored with the data and then write the statistical methods and results sections of a scientific paper. This final assignment brings together many of the skills that they have learned in the course: finding and using literature to develop hypotheses, choosing appropriate statistical analyses, interpreting results, and using papers read in the course as examples for communicating science.
SHORT- AND LONG-TERM OUTCOMES
Students self-reported increased confidence in developing hypotheses, understanding graphs, graphing data, and analyzing data (Figure 4) at the end of the course. It is interesting to note that the students taking the course in the Winter 2016 term had taken our new first-year introductory sequence (2), while the Fall 2014 students had taken our 'old' three-term introductory sequence. While both classes reported increased confidence in developing hypotheses, and graphing and analyzing data, the Winter 2016 class did not report an improvement in understanding graphs (Figure 4B). We think this result reflects a greater emphasis on interpreting results in our new intro sequence, as the Winter 2016 course had much greater confidence in their ability to interpret graphs as the beginning of the course than the Fall 2014 class did at the end of the course.
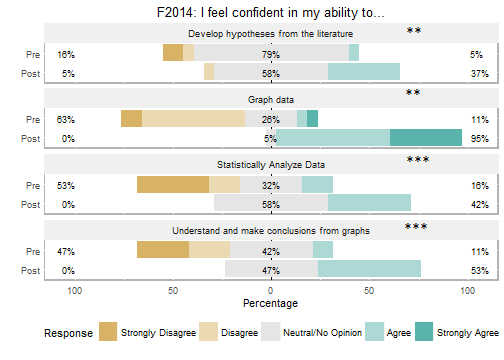
Figure 4. Pre- and post-term students’ self-assessment of confidence in their ability in four competencies in A) Fall 2014 and (B) Winter 2016. Pre- and post-term scores were compared using a Wilcoxon Sign Test; NS = not significant; ** = significance level at p < 0.01, *** = significance level at p < 0.001.
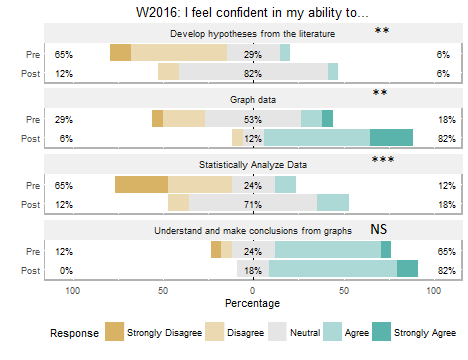
Figure 4. Pre- and post-term students’ self-assessment of confidence in their ability in four competencies in A) Fall 2014 and (B) Winter 2016. Pre- and post-term scores were compared using a Wilcoxon Sign Test; NS = not significant; ** = significance level at p < 0.01, *** = significance level at p < 0.001.
While students found R challenging, their comments at the end of the Fall 2014 (our first iteration of the course) suggested that they found R to be worth the challenge:
- "R is incredibly challenging, but very relevant for use in biology as a field. Being able to use this tool for a range of purposes will likely be the single most important take-away from the class and spending more time with more detail on that will help generalize our activities to classes beyond toolkit."
- "R studio and the skills I have developed in using it will be the most useful things I walk away from this class with; it is important in my mind to continue teaching them."
- ".....I definitely think that, through learning to use R, I've really improved my abilities to interpret data and understand what statistical tests and their results mean. I know that R can be frustrating, but I've found it to be the most interesting and rewarding part of this class."
We have seen the skills learned in Toolkit transferred and expanded upon in our upper-level courses and in student independent research (Table 1).
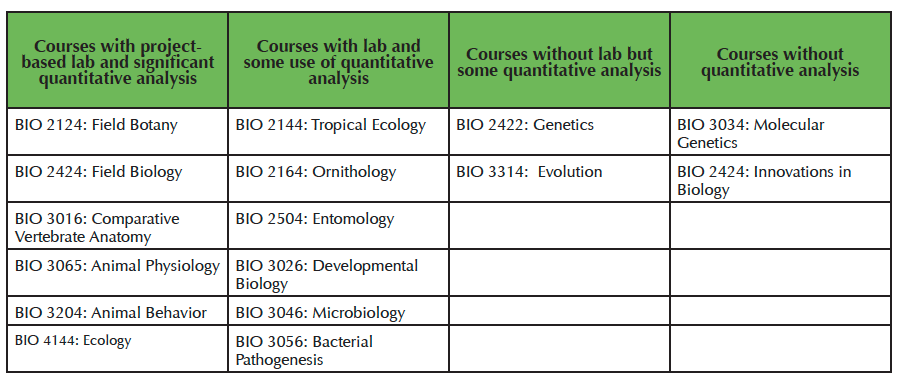
Table 1. Upper-level courses offered by the Transylvania Biology program organized by lab approach and amount of quantitative analysis required by the course.
Two of the instructors of Toolkit extensively emphasize data analysis in upper-level courses, Ecology (SRB) and Animal Behavior (JDW). In Ecology, SRB expanded upon statistics learned in Toolkit by including data analysis assignments that explored some of the more common expansions of ANOVA and general linear models found in field experiments. Students also analyze the results of their lab projects using R. In Animal Behavior, students develop semester-long group projects. In the past, JDW performed all analyses for groups; in Fall 2015, all groups, except for one pair that had not completed Toolkit, performed their own analyses. The group who did not have knowledge of R worked with friends outside of class who had completed the Toolkit course and with assistance conducted their analysis and created publication-quality graphs along with the rest of the class. Some instructors have open-ended literature-based assignments that do not necessarily require quantitative analysis. Impressively, they have found that several students have intentionally chosen quantitative projects and analyze their data in R. We have been particularly pleased with our independent research students who have not only embraced R, but have the confidence and independence to learn new analyses on their own with limited guidance from their faculty mentors. Finally, although not one of our original goals for Toolkit, the Vision and Change competency of interdisciplinarity seems to have been unintentionally conveyed in this course. One of our students who is a double major in biology and political science, used R to analyze the speech of 2016 presidential candidates for his capstone project. We also have seen a rise the number of students interested in taking computer science courses. Toolkit seems to have also broadened students' view of career possibilities in the sciences. This year, we sent our first graduate in recent memory to a master's program in biostatistics.
CHALLENGES WITH THE COURSE
We recognized two levels of challenges in creating and operating the Biologist's Toolkit course within our program. One level of challenge was what we call mechanistic challenges and these are issues dealing with students and faculty learning the software, teaching students computer file structure and storage protocols, and understanding how to set up R and RStudio in a diversity of computers (PC and Mac) that often utilize a diversity of operating systems. The other level of challenges are cultural and curriculum challenges in that they extend beyond the faculty who specifically teach the Toolkit course, since it requires the entire biology faculty to integrate the skills learned by the students within the Toolkit course into their own upper-level course.
MECHANISTIC CHALLENGES
The challenge in using R is also its strength as a teaching tool: one must plan carefully and be very mindful when doing data analysis or graphing, since you must type specific commands with specific syntax. This challenge is offset by the myriad of free and easily available resources on the internet that aid and assist in programming R. For example, you may not know specifically how to add error bars to your graph but asking "how to make error bars in R" in a Google search returned over 17 million results with detailed YouTube videos and online course materials that walk you through the process within the first two pages of the search (9,10). It has been our experience that it is more of a challenge to find a problem in R scripting that has not been resolved online, which reminds us of how unoriginal most of our problems are.
The first few times we taught the course, we did not appreciate the lack of understanding our students had concerning file formats, addresses, and file locations. As a result, the majority of student problems resulted from not having R looking in the correct location for the data file. We now approach the problem directly with a class dedicated to showing students how and where computer files are located and we standardize file locations within each student's computer by creating a master directory called Toolkit and then within that master directory two subdirectories, one called Data and the other called Scripts. By standardizing file location and directory structure, the faculty can quickly orient themselves within each student's computer and more quickly resolve operating problems the students may have. It is also important to develop a firm and secure foundation of understanding within the students as to the difference between a text (.txt) file and a comma separated value (.csv) file from a Word (.docx) and Excel (.xlsx) files. Rarely do students consider the format of a file, since computers typically open the file with the appropriate software without asking. However, using R requires the students always consider the format of their data and ensure it is the proper file format for R to use.
The last mechanistic challenge we have encountered is the diversity of students within the class, which is mirrored by the diversity of laptops, tablets, and portable computer systems and their subsequent unique operating system each student brings to the class. Luckily, R and the console RStudio are robust and operate well within Mac, Linux, and Microsoft operating systems. Prior to the first class, we require the students to download the most up-to-date basic R program (https://www.r-project.org/) and RStudio (https://www.rstudio.com/products/rstudio/download/) and have them saved on their computer. In class we walk them through the installation and file directory system mentioned above. We can accomplish these goals in a 50-minute class with up to 30 students and their menagerie of computers and computer systems.
CULTURAL AND CURRICULAR CHALLENGES
One of the major challenges for a course like Biologist's Toolkit is to ensure that skills developed in the course are integrated across the curriculum. This challenge is exacerbated by the fact that different fields of biology rely on statistical data analysis to different degrees. For example, ecology and its derivations (e.g., behavioral ecology, community ecology, etc.) have a long history of relying on sophisticated statistical analysis to discern signal from noise. In contrast, fields like microbiology, developmental biology, and other molecular scaled disciplines often rely on absolutes rather than on statistics. To accomplish integration of statistical skills, we agreed that all biology faculty should integrate into their courses student-driven data analysis, interpretation, and presentation to reinforce the skills the students learned in Toolkit. This approach enables students to understand how the various disciplines of biology utilize quantitative analysis to aid in their understanding of the world. In our program, most of the upper-level courses rely on student-designed research projects that generate data to test a hypothesis (Table 1). Therefore, data analysis, graphing and interpreting data became a natural extension of the upper-division lab experience.
Given the disparity in statistical and programming skill of faculty, students frequently ask those faculty members who are most adept in R for help on projects the students are doing with other faculty. In preparing for a Toolkit course that relies on R, it is valuable to have at least two faculty who are willing to teach the course and learn to code in R, as they can rely on each other for technical support and share the load of advising students in projects that use R. We have tried to minimize the demands on the R-savvy faculty by fostering a community-minded approach to use of R in the Toolkit course. Specifically, we teach students to search on the internet for solutions to R script problems, encourage them to discuss and share scripts with their peers, and most importantly, remind them to use their Toolkit notebooks and annotated scripts to guide them in their data analysis projects. Of course, it is easiest for students to simply ask for help before trying to resolve the problem themselves, so another challenge is to train the students to first try to resolve the problem on their own before meeting with a faculty for help. One of the faculty (PMD) required students who wanted to meet with him to first do an internet search on the specific error code since the diversity and activity of the R community means that almost every problem has already been identified and resolved online. Of course, it takes more initial time to train the students to resolve their own programming problems than it takes to write the code for them. Nevertheless, faculty must resist the urge to quickly supply the answer. Since the students learn R scripting skills as sophomores and then are asked to use these skills in their biology classes for the next two years, it pays great dividends to invest early in training the students to be independent in resolving their R script problems.
CONCLUSIONS
Based on our experience across three years and three faculty teaching the course, a required course dedicated to developing quantitative skills and scientific communication greatly improves students' abilities to be active scientists throughout their undergraduate experience. Although data analysis and quantitative thinking skills can be integrated into introductory biology courses (11), these efforts are often constrained by time and other goals of the courses. By devoting an entire course to foundational skills in analyzing, presenting, and communicating quantitative data, students enter upper-level courses with core skills and habits of mind of practicing biologists. As the biology faculty have adopted the use of RStudio in upper-level courses, we are integrating quantitative skills throughout the curriculum (12) and increasing students' quantitative sophistication. Although there are mechanistic and cultural/curricular challenges to our approach, we believe that sharing our missteps will allow others to avoid many of these challenges. The confidence we see in our students, their increased independence, and their own acknowledgement of the importance of this course demonstrate the value of the Toolkit course to implement goals of Vision and Change.
SUPPORTING MATERIALS
- S1. BiologistsToolkit-TU Curriculum
- S2. BiologistsToolkit-Syllabus for Biologists Toolkit
- S3. BiologistsToolkit-Homework Example
- S4. BiologistsToolkit-Example of a script written and annotated by a student for a homework assignment
- S5. BiologistsToolkit-Final Project Description
ACKNOWLEDGMENTS
We thank the biology students at Transylvania University who rose to the challenge of this course and gave us thoughtful feedback on various iterations of the course. We also thank R. Wright for helpful comments on a previous draft.
References
- AAAS. 2011. Vision and Change: A Call to Action, Final Report.
- Wagner JD, Campbell MA, Sly BJ, Paradise CJ. 2015. An active textbook converts "Vision and Tweak" to Vision and Change. CourseSource 2:1-9.
- Ellison AM, Dennis B. 2010. Paths to statistical fluency for ecologists. Front Ecol Environ 8:362-370.
- Muenchen RA. 2015. The popularity of data analysis software. http://r4stats.com/articles/popularity/
- Valle D, Berdanier A. 2012. Computer programming skills for environmental science. Bull Ecol Soc Am 93:373-389.
- Basturk R. 2005. The effectiveness of computer-assisted instruction in teaching introductory statistics. Educ Technol Soc 8:170-178.
- R Core Team. The R Datasets Package.https://stat.ethz.ch/R-manual/R-devel/library/datasets/html/00Index.html
- Gardener M. 2012. Statistics for Ecologists Using R and Excel. Pelagic Publishing, Exceter.
- Mangiafico SS. 2015. An R Companion for the Handbook of Biological Sciences, versions 1.09. http://rcompanion.org/rcompanion/
- Data Services. Introduction to R Graphics with ggplot2. Harvard Univeristy. http://tutorials.iq.harvard.edu/R/Rgraphics/Rgraphics.html
- Goldstein J, Flynn DFB. 2011. Integrating active learning & quantitative skills into undergraduate introductory biology curricula. Am Biol Teach 73:454–461.
- Remsburg BAJ, Harris MA, Batzli JM. 2014. Statistics across the curriculum using an iterative, interative approach in an inquiry-based lab sequence. J Coll Sci Teach 44:72–81.
Article Files
Login to access supporting documents
Thinking deeply about quantitative analysis: Building a Biologist's Toolkit(PDF | 1 MB)
S1.BiologistsToolkit-Four-year biology curriculum.pdf(PDF | 263 KB)
S2.BiologistsToolkit-Syllabus for Biologists Toolkit.pdf(PDF | 349 KB)
S3.BiologistsToolkit-Homework Example.pdf(PDF | 184 KB)
S4.BiologistsToolkit-Example of a script written and annotated by a student for a homework assignment.txt(TXT | 2 KB)
S5.BiologistsToolkit-Final Project Description.pdf(PDF | 184 KB)
- License terms

Comments
Comments
There are no comments on this resource.