Collections
Joshua Mays created this post
@
on
Instructor Notes and Supplemental Critical Analysis Activity -- Gaston College
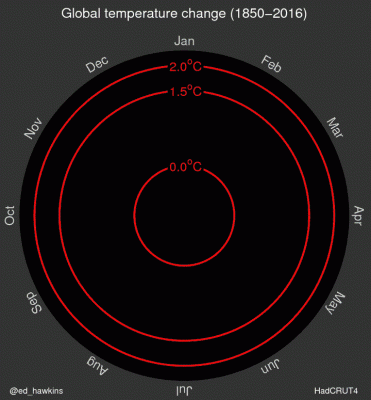
- http://nerdist.com/watch-166-years-of-climate-change-spiral-in-one-definitive-gif/
- Mays_TIEE_Phenology_Supplemental_Activity.docx
Linked is a really neat .gif graph that shows temperature change over time. It is easy to interpret and helps supplement the phenology module.
Also attached is a supplemental activity (class discussion) that helps illuminate how some entities present real data in a biased fashion to convince the reader of specific views. Students work as a group to bias real data, engage in a class discussion, and find real examples of biased data in social media/current events.
Instructor's Notes:
This TIEE module was implemented over the course of two days in a lab setting for community college students enrolled in a major's biology course. I began with the pre-workshop excel graphing activity by Calinger, had students work on the module without modifications, and ended with my critical analysis supplemental activity attached above.
Investigating the footprint of climate change on phenology and ecological interactions in north-central North America

Materials related to this TIEE module by Kellen Calinger, Ohio State University, 2014
Gabriela Hamerlinck
@
on
