Collections
Drew LaMar created this post
@
on
Visualizing a One-Way ANOVA using D3.js
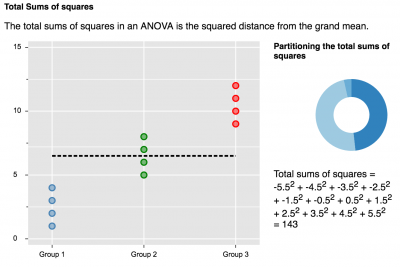
A while ago I was playing around with the JavaScript package D3.js, and I began with this visualization—that I never really finished—of how a one-way ANOVA is calculated. I wanted to make the visualization interactive, and I did integrate some interactive elements. For instance, if you hover over a data point it will show the residual, and its value will be highlighted in the combined computation. The circle diagram show the partitioning of the sums of squares, and if you hover a part it will show from where the variation is coming. I tried to make the plots look like plots from the R-package ggplot2.
Created by Kristoffer Magnusson
Drew LaMar onto Visualizing Statistics
@
on
Visualizing Statistics
This collection contains visualizations and animations to help students grasp statistical concepts.
Drew LaMar
@
on
