Collections
Kristin Jenkins created this post
@
on
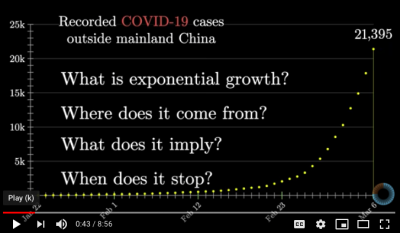
COVID 19 example of exponential growth, logistic curves and inflection points
From 3Blue1Brown animated math collection: https://www.3blue1brown.com/
Kristin Jenkins onto COVID-19/Public Health
@
on

John R Jungck @ on
COVID-19 Models
This Excel workbook implements an SIR (Susceptible/Infectious/Recovered) model for the spread of an infectious disease. The user specifies the initial population, including the percentages of infected and recovered individuals, as well as the transmission and recovery rates. The workbook then tracks the epidemic over 100 time steps, plotting the results over time as well as generating the corresponding S/I phase plot. The model and graphs automatically update as parameter values are changed, visually demonstrating each parameter's effect on the disease's spread.
The basic SIR model serves as a starting point for developing more sophisticated models including features such as demographic groups with different health risks, the effects of public health measures, natural birth and death rates, and the impact of stochasticity (randomness). Versions of these models are included on separate worksheets. Users are encouraged to use these examples to develop customized models that include additional features (e.g., vector transmission, latency period), or that combine multiple features to model the spread of a specific disease.
As a featured Resource Walk-Through in the Teaching Quantitative Biology Online group, you can learn more about the module and participate in a discussion:
Resource Walk-Through
Professor Anton Weisstein, Department of Biology, Truman State University YouTube:
https://www.youtube.com/watch?v=A8wjffz93uw @2 minutes 26 seconds
Professor Sam Donovan, University of Pittsburgh, BioQUEST Curriculum Consortium, YouTube:
https://www.youtube.com/watch?v=-8eXmWHr19s 26 minutes with Professor Anton Weisstein, Department of Biology, Truman State University YouTube:
https://qubeshub.org/community/projects/esteemresources/publications/1794/content/continue/1?version=1
SIR-Build-It_REVISED_2018
SIR_Model_Documentation
Author(s): Maria Shumskaya, Shakira Benjamin, Matthew G Niepielko, and, Nicholas Lorusso
Kean University
File: COVID19data 8769.xls
1032 total view(s), 310 download(s)
Summary:
Introduction into heat maps, non-parametric t-test and GIF (optional) in R using an original dataset on COVID-19 infections from different counties of New Jersey, USA. Suitable for students who have basic experience in R.
(4) Project Darien (Professor Norman Wagner, University of Delaware)
https://sites.udel.edu/udcovidmodel/sample-page/about-the-model-downloads/
Project Darien’s COVID-19 Model is available in both Web and Desktop App formats. You can launch the model online in a new tab by clicking the ‘Web Launcher’ button, or download it to your computer for offline use!
Both versions come with easy, step-by-step instructions and a variety of sliders for you to play with. These sliders affect the exposure of the virus, such as how many students started out sick, and whether or not sick students are vaccinated. Create your own scenarios out of curiosity, or pair your discoveries with a student ACTivity! (More information on the right).
Desktop version is powered by the NetLogo software environment. App size: ~ 50KB.
CDC Site on COVID:
https://www.cdc.gov/coronavirus/2019-ncov/index.html
Exponential growth and epidemics
Excellent video introduction to exponential growth and COVID
https://www.youtube.com/watch?v=Kas0tIxDvrg
3Blue1Brown
https://www.3blue1brown.com/topics/epidemics