Collections
Arietta Fleming-Davies created this post
@
on
Instructions for Using Radiant for Data Visualization
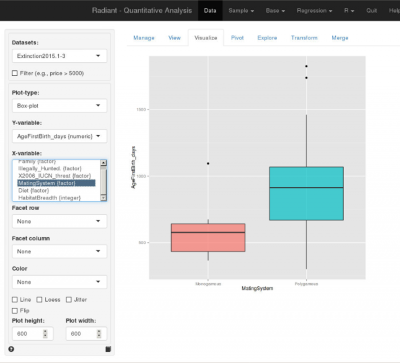
As part of the extinction module, students can use the R Shiny app Radiant to explore and visualize the data. Radiant also has a unique and useful feature for instructors: the ability to automatically generate a report of student workflow. This allows faculty to follow students' exploration of the data and decision-making processes. The attached handout (Copy of Student Handout 5) contains the updated instructions for running Radiant on the QUBESHub website and generating a workflow report.
Additional resources for teaching "Staying Alive"

This collection is to be used to help teach the module Staying Alive: Extinction Risk: Introduction to Extinction and Extinction Bias
Atteh Akoto
@
on
