Developing Data Literacy Skills and Connecting the Student Experience in the Classroom to the Community Through Biodiversity Projects

Undergraduate education and long-term science literacy are enhanced by integrating data projects with public datasets and creating analysis summaries. Underutilized public datasets are often generated by community-based or citizen science projects to address conservation issues supported by local residents. The objectives of this course activity are for students to contribute to a community science project, observe local species diversity, develop biodiversity questions, and apply data science techniques. Engaging students in these local projects enhances their understanding of the scientific process and its broader impacts on their community. The City Nature Challenge (CNC) is an annual global community science event where students participate by documenting species observations with the iNaturalist application, similar to localized BioBlitz events. Students are guided through using the iNaturalist database to practice biodiversity calculations then data is collected through participation in CNC (or a BioBlitz event an instructor arranges for their class). Spreadsheet software is used by students to organize, analyze, and summarize their relevant data to their peers. Students join the iNaturalist community of observers, which includes professional and non-professional naturalists. Therefore, students can see the themselves as scientists by contributing locally relevant data to a global and digital community of scientists. Experience working with large datasets such as the CNC iNaturalist dataset is essential for STEM careers and building data literacy. Implementing these experiences in classrooms will provide students unique opportunities to learn more about local biodiversity, develop interdisciplinary skills and positively influence a global network of scientists.

Primary image: Students recording biodiversity observations in an open field. At the annual Macaulay Honors College BioBlitz, students are divided into teams to explore a specific NYC park and record the animal and plant life they observed, which they later used to generate biodiversity reports including the species richness and abundances for the park.

0 comments 4 reposts

Profile picture of Erika Crispo

Erika Crispo onto BEDE

Three Research-Based Quantitative Reasoning Modules for Introductory Organismal Biology Laboratories

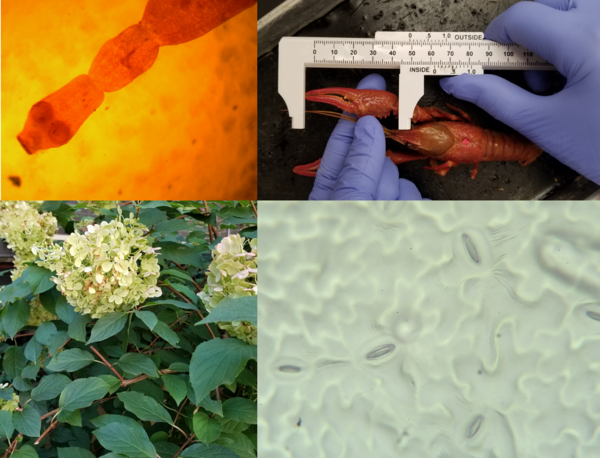
We have designed three laboratory modules for an introductory organismal biology course with an emphasis on quantitative reasoning and data analysis skills. Module 1 tests for dimorphism in crayfish chelae using a paired statistical design. Module 2 tests for allometric growth of tapeworm hook structures using a regression model. Module 3 tests for differences in stomatal densities between two groups of plants using a two-sample statistical approach. For all three modules, we emphasize the use of confidence intervals to draw statistical conclusions about hypotheses. Knowledge about the basic biology of animals and plants is required, including arthropods, platyhelminths, and vascular plants. Background reading on dimorphism, allometry, and transpiration provides the necessary foundation to develop questions and hypotheses. Some familiarity with R is necessary for both students and instructors, although the activities can be modified for analysis with Excel or another statistical package. These modules can be taught independently or together as a unit within a course. As stated in the AAAS document, Vision and Change: A Call to Action, the ability to use quantitative reasoning is a core competency that must be developed by all biology students. These modules address the call for instruction in quantitative reasoning and provide a hands-on active introduction to key tools that will be required to build students’ statistical repertoire in more advanced courses.

Primary Image: A highlight of the three modules used in our introductory organismal biology course, including the use of calipers to test for dimorphism in the size of crayfish chelae (upper right), a leaf impression (lower right) from a hydrangea plant (lower left) used to test hypotheses about stomata densities, and the image of an Echinococcus tapeworm (upper left) to test hypotheses about allometry.  

0 comments 2 reposts

Profile picture of Erika Crispo

Erika Crispo onto BEDE

Quantifying and Visualizing Campus Tree Phenology

Cards to include on website

0 comments 2 reposts

Profile picture of Erika Crispo

Erika Crispo onto BEDE

Hardy-Weinberg Equilibrium: a swirl resource

Students will use swirl to understand Hardy-Weinberg equilibrium. The lesson starts with observed numbers of individuals for each genotype, and students will work through a number of steps to assess whether or not the population is in equilibrium.

0 comments 3 reposts

Profile picture of Erika Crispo

Erika Crispo onto evolution