Collections

Molecular CaseNet Biweekly Meeting related (Mar 3, 2023)

0 comments 0 reposts

Profile picture of Shuchismita Dutta

Shuchismita Dutta onto Meeting Recordings

Including Diverse Scientists for an Inclusive Class

Well, my friends, it's Black History Month, so I want to share with you some important Black scientist sites and several NSF-funded projects where you can learn about creating materials or using materials others have created....

0 comments 0 reposts

Molecular CaseNet Biweekly Meeting related (Feb. 17, 2023)

0 comments 0 reposts

Profile picture of Shuchismita Dutta

Shuchismita Dutta onto Meeting Recordings

Black History Month Resource Collection 2023

In honor of Black History Month the BioQUEST team is putting together a collection of resources highlighting contributions from Black scientists, educators, and scholars. February should not be the only month where we honor the important contributions of Black STEM professionals, but we believe that BHM is the perfect time to capture some momentum and share some resources!

Anyone with a QUBESHub account can add to this resource so please share your favorite Black-centered resources here!

2 comments 0 reposts

Black History Month: 20 Black trailblazers in science and biotechnology that you need to know

The Biotechnology Innovation Organization brings us this resource of 20 Black trailblazers in science and biotechnology and includes a brief summary and external links to resources for each person. 

0 comments 0 reposts

Black History Month 2023 - Science and Medicine

List of Blackhistorymonth.org.uk articles that are relevant to science and medicine.

0 comments 0 reposts

What’s science got to do with Black History Month?

The Biotechnology Innovation Organization brings us this resource of 20 Black trailblazers in science and biotechnology and includes a brief summary and external links to resources for each person. 

0 comments 1 reposts

African American Scientists: Celebrating Black History Month

Promega Connections brings us a blog highlighting the contributions of 6 African American scientists

0 comments 0 reposts

35 Scientists from Black History Month

In honor of Black History Month, we highlight 35 African American scientists and engineers who made important contributions to science, technology, engineering, and math (STEM). There are many, many scientists who could be included on this list!

0 comments 0 reposts

100 inspiring Black scientists in America

Cell Mentor compiled a list of 100 inspiring Black scientists in America! 

0 comments 0 reposts

16 Black History Month STEM Activities

iD Tech shares 16 STEM teaching activities in honor of Black History Month. Geared towards K-12, but general enough to be easily adapted. 

0 comments 0 reposts

Using Open-Source Bioinformatics and Visualization Tools to Explore the Structure and Function of SARS-CoV-2 Spike Protein

The relationship between protein structure and function is a foundational concept in undergraduate biochemistry. We find this theme is best presented with assignments that encourage exploration and analysis. Here, we share a series of four assignments that use open-source, online molecular visualization and bioinformatics tools to examine the interaction between the SARS-CoV-2 spike protein and the ACE2 receptor. The interaction between these two proteins initiates SARS-CoV-2 infection of human host cells and is the cause of COVID-19. In assignment I, students identify sequences with homology to the SARS-CoV-2 spike protein and use them to build a primary sequence alignment. Students make connections to a linked primary research article as an example of how scientists use molecular and phylogenetic analysis to explore the origins of a novel virus. Assignments II through IV teach students to use an online molecular visualization tool for analysis of secondary, tertiary, and quaternary structure. Emphasis is placed on identification of noncovalent interactions that stabilize the SARS-CoV-2 spike protein and mediate its interaction with ACE2. We assigned this project to upper-level undergraduate biochemistry students at a public university and liberal arts college. Students in our courses completed the project as individual homework assignments. However, we can easily envision implementation of this project during multiple in-class sessions or in a biochemistry laboratory using in-person or remote learning. We share this project as a resource for instructors who aim to teach protein structure and function using inquiry-based molecular visualization activities.

Primary image: Exploration of SARS-CoV-2 spike protein: student generated data from assignments I - IV. Includes examples of figures submitted by students, including a sequence alignment and representations of 3D protein structure generated using UCSF Chimera. The primary image includes student generated data and a cartoon from Pixabay, an online repository of copyright free art. 

0 comments 5 reposts

Profile picture of Erin Weber

Erin Weber onto Biochem

When tests disagree, how do I know if I have COVID-19?

Students will learn about infectious disease and the immune response to infection by investigating different types of tests (PCR, antigen, and antibody tests) to detect the SARS-CoV-2 viral genetic material, antigens, or anti-SARS-CoV-2 antibodies. In the activity, students will apply core concepts and competencies from Vision & Change (https://visionandchange.org/). The activity uses a jigsaw format, with students choosing one of three specialities (epidemiologist, infectious disease doctor, or immunologist) and completing an assignment, either in-class or as homework, based on their speciality. In groups, students first hold a conference by speciality, then teams with representatives from each speciality discuss possible conclusions using results from the three different tests for a hypothetical patient.

0 comments 1 reposts

Profile picture of Sumali Pandey

Sumali Pandey onto ImmunoReach Teaching Resources

Molecular CaseNet Biweekly meeting related (Feb. 3, 2023)

0 comments 0 reposts

Profile picture of Shuchismita Dutta

Shuchismita Dutta onto Meeting Recordings

Celebrating Black History Month

Pat shared this link

0 comments 0 reposts

Profile picture of Shuchismita Dutta

Shuchismita Dutta onto Scientist Spotlight related

A Kinesthetic Modeling Activity to Teach PCR Fundamentals

Most molecular biology and biological sciences students understand that the polymerase chain reaction (PCR) is used to amplify DNA. However, we have found that some students experience conceptual misunderstandings, a lack of detailed comprehension of the PCR process, or difficulties with troubleshooting and predicting the effects of alterations to the standard PCR process. We hypothesized that a problem-based learning approach that incorporates a kinesthetic modeling of the PCR process could address these problems. During this hands-on learning activity, students “amplified” a specific region of template DNA through three cycles of PCR using a “toolkit” composed of a) intertwined, supercoiled, and double-stranded yarn representing template DNA, b) short wax sticks representing primers, and c) long wax sticks representing the PCR products. Instructors can introduce a variety of assessments, including real-time image capture of the models, pre- and post-activity assessment quizzes, and homework assignment to gauge student learning. We administered identical four-question quizzes worth 12 points to 28 undergraduate students before and after the activity. The mean score on the post-quiz was three points higher than the pre-quiz score, demonstrating a 75% increase in score. Moreover, we found that students who began the activity with lower levels of understanding experienced the most significant learning gains. This hands-on, student-centered, kinesthetic activity allowed students to (i) visualize PCR processes, (ii) construct a model of the PCR process, (iii) correct common misconceptions and sources of confusion, and (iv) actively engage in the learning process.

0 comments 2 reposts

Profile picture of Michael Moore

Michael Moore onto 2171 Ideas

Mapping a Mutation to its Gene: The "Fly Lab" as a Modern Research Experience

Although genetics is an invaluable part of the undergraduate biology curriculum, it can be intimidating to students as well as instructors: Students must reduce their reliance on memorization and dive deep into quantitative analysis, and instructors must make a long, rich history of genetics experiments clear, coherent, and relevant for students. Our Lesson addresses these challenges by having students map an unknown mutation to its gene using a modern suite of genetic tools. Students receive a Drosophila melanogaster strain with a mutation that causes the normally flat wing to bend at distinct sites along its length. Although we recently mapped this mutation to its gene, here we have renamed it "crumpled wing" (cw), an example of a pseudonym that you could use in the classroom. Like many standard "fly labs" that are taught at undergraduate institutions, this Lesson reinforces classic genetics concepts: students selectively mate fly strains to determine mode of inheritance, test Mendel's Laws, and three-point map an unknown mutation relative to known markers. But here, we expand on this tradition to simulate a more modern primary research experience: we greatly increase mapping resolution with molecularly-defined transgene insertions, deletions, and duplications; then cross-examine our data with key bioinformatic resources to identify a short-list of candidate cw genes. After extensive data interpretation and integration, students have been able to map cw to a single gene. This Lesson has a flexible design to accommodate a wide range of course structures, staffing, budgets, facilities, and student experience levels.

0 comments 2 reposts

Profile picture of Michael Moore

Michael Moore onto 2171 Ideas

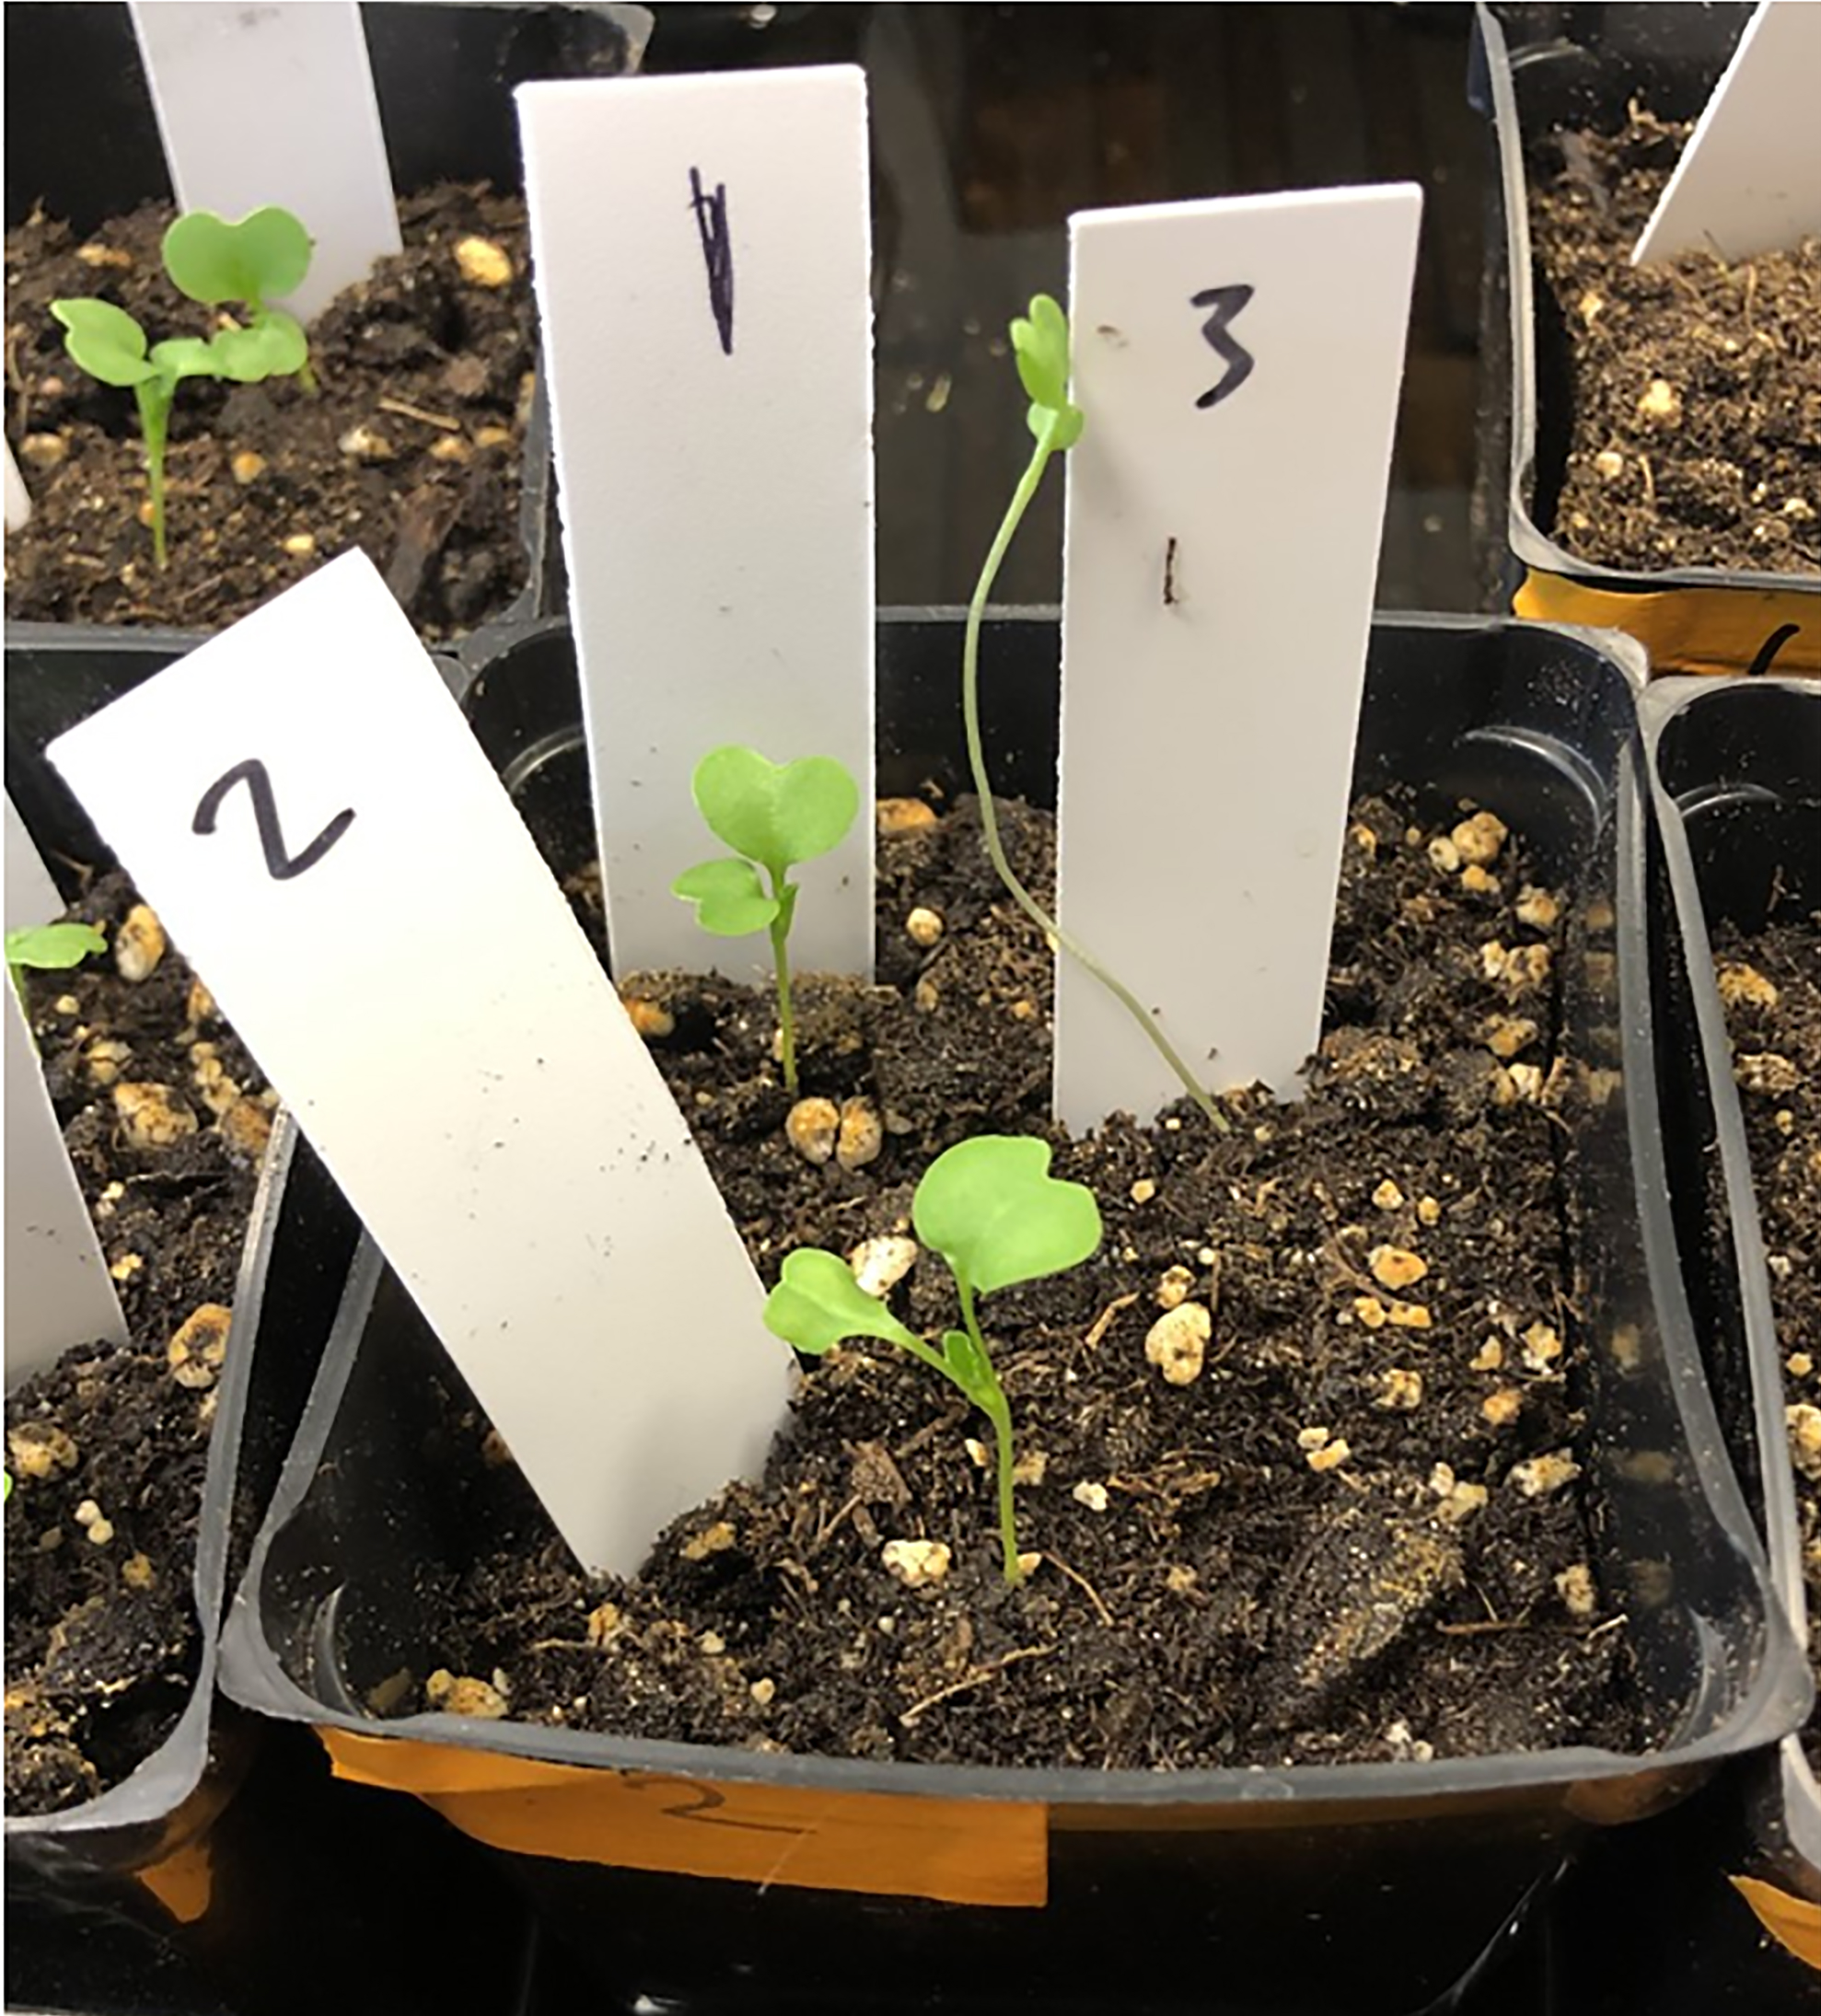
A Rapid Genetic Screen Using Wisconsin Fast Plants<sup>®</sup>: A Hands-On Approach to Inheritance of <i>de novo</i> Mutations

Some concepts in genetics, such as genetic screens, are complex for students to visualize in a classroom and can be cumbersome to undertake in the laboratory. Typically, very large populations are needed, which can be addressed by using micro-organisms. However, students can struggle with phenotyping microbes. For macroscopic organisms, the number of offspring produced, and the generation time can be challenging. I developed this lesson as a small-scale genetic screen of Fast Plants®. These plants are amenable to teaching labs as they have simple growth requirements, a short generation time, and produce numerous seeds that can be stored for years. Seeds used for this screen are purchased pre-treated with a DNA damaging agent, removing the need for in-house use of mutagens. Also, students can screen the phenotypes without specialized equipment. The initial lesson begins with an examination of the first generation of plants. Later their offspring are screened for altered phenotypes. Students responded well to having full-grown plants available on the first day of the lab project. This lesson fostered student collaboration, as they worked with class datasets. Differences in growth due to mutagenesis treatment in the first generation were clear to students who had not worked with plants before. Identifying plants with altered phenotypes in the next generation was more of a challenge. This lesson incorporates key concepts such as somatic and germline mutations, the impact of such mutations on phenotype, and the inheritance of mutation alleles, and provides a hands-on way to illustrate these concepts.

Primary Image: Fast Plant® phenotype differences observed in the M2 generation. This pot contains three full-sibling M2 seedlings from a single M1 parent plant. The seed of their parent plant received 50 Krads of radiation. Plants 1 and 2 are of standard height, while plant 3 is greatly elongated. Image by AL Klocko.

0 comments 4 reposts

Profile picture of Michael Moore

Michael Moore onto 2171 Ideas

Developing Data Literacy Skills and Connecting the Student Experience in the Classroom to the Community Through Biodiversity Projects

Undergraduate education and long-term science literacy are enhanced by integrating data projects with public datasets and creating analysis summaries. Underutilized public datasets are often generated by community-based or citizen science projects to address conservation issues supported by local residents. The objectives of this course activity are for students to contribute to a community science project, observe local species diversity, develop biodiversity questions, and apply data science techniques. Engaging students in these local projects enhances their understanding of the scientific process and its broader impacts on their community. The City Nature Challenge (CNC) is an annual global community science event where students participate by documenting species observations with the iNaturalist application, similar to localized BioBlitz events. Students are guided through using the iNaturalist database to practice biodiversity calculations then data is collected through participation in CNC (or a BioBlitz event an instructor arranges for their class). Spreadsheet software is used by students to organize, analyze, and summarize their relevant data to their peers. Students join the iNaturalist community of observers, which includes professional and non-professional naturalists. Therefore, students can see the themselves as scientists by contributing locally relevant data to a global and digital community of scientists. Experience working with large datasets such as the CNC iNaturalist dataset is essential for STEM careers and building data literacy. Implementing these experiences in classrooms will provide students unique opportunities to learn more about local biodiversity, develop interdisciplinary skills and positively influence a global network of scientists.

Primary image: Students recording biodiversity observations in an open field. At the annual Macaulay Honors College BioBlitz, students are divided into teams to explore a specific NYC park and record the animal and plant life they observed, which they later used to generate biodiversity reports including the species richness and abundances for the park.

0 comments 4 reposts

Profile picture of Erika Crispo

Erika Crispo onto BEDE

Three Research-Based Quantitative Reasoning Modules for Introductory Organismal Biology Laboratories

We have designed three laboratory modules for an introductory organismal biology course with an emphasis on quantitative reasoning and data analysis skills. Module 1 tests for dimorphism in crayfish chelae using a paired statistical design. Module 2 tests for allometric growth of tapeworm hook structures using a regression model. Module 3 tests for differences in stomatal densities between two groups of plants using a two-sample statistical approach. For all three modules, we emphasize the use of confidence intervals to draw statistical conclusions about hypotheses. Knowledge about the basic biology of animals and plants is required, including arthropods, platyhelminths, and vascular plants. Background reading on dimorphism, allometry, and transpiration provides the necessary foundation to develop questions and hypotheses. Some familiarity with R is necessary for both students and instructors, although the activities can be modified for analysis with Excel or another statistical package. These modules can be taught independently or together as a unit within a course. As stated in the AAAS document, Vision and Change: A Call to Action, the ability to use quantitative reasoning is a core competency that must be developed by all biology students. These modules address the call for instruction in quantitative reasoning and provide a hands-on active introduction to key tools that will be required to build students’ statistical repertoire in more advanced courses.

Primary Image: A highlight of the three modules used in our introductory organismal biology course, including the use of calipers to test for dimorphism in the size of crayfish chelae (upper right), a leaf impression (lower right) from a hydrangea plant (lower left) used to test hypotheses about stomata densities, and the image of an Echinococcus tapeworm (upper left) to test hypotheses about allometry.  

0 comments 2 reposts

Profile picture of Erika Crispo

Erika Crispo onto BEDE

Quantifying and Visualizing Campus Tree Phenology

Cards to include on website

0 comments 2 reposts

Profile picture of Erika Crispo

Erika Crispo onto BEDE