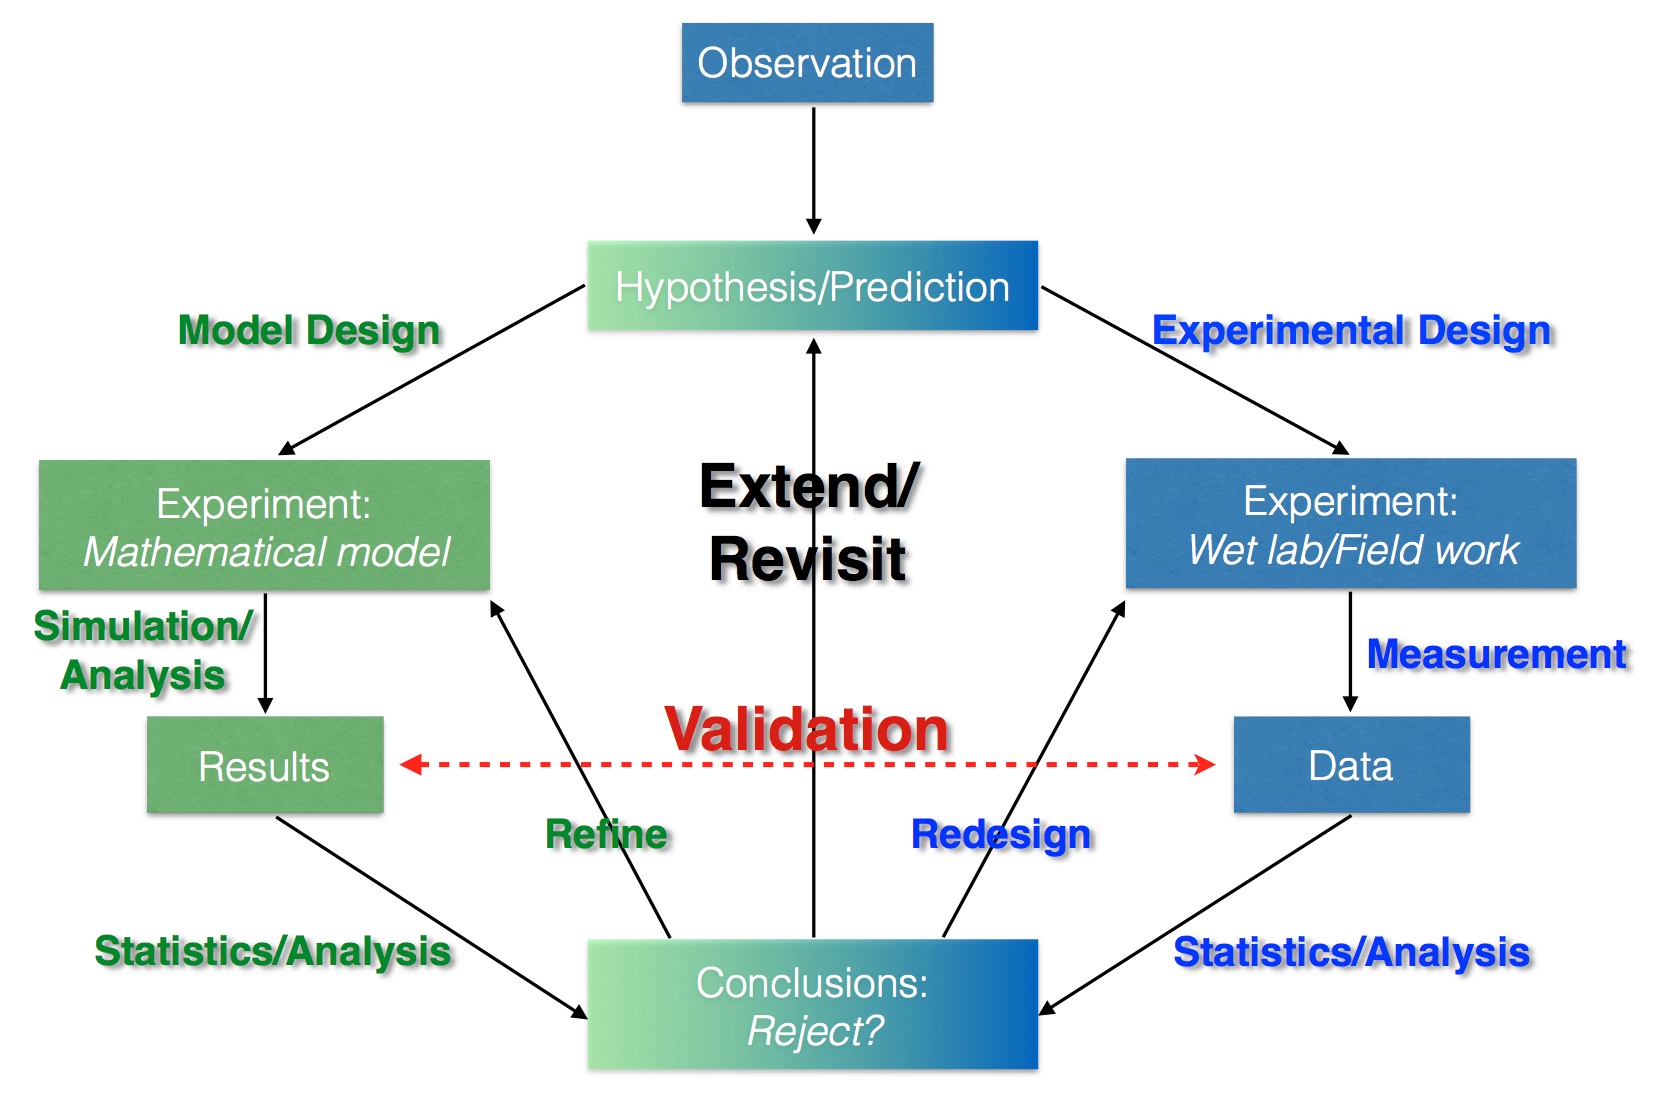
Introduction to Quantitative Biology at William and Mary
Class Project Description
Categories of projects: Examples of types of projects accepted
- (Option 1) Pick a primary article with some quantitative biology techniques and reproduce their results.
- (Option 2) Same as Option 1, but reproduce and extend their results.
- (Option 3) Formulate a biological hypothesis in the area of your choosing, and develop/analyse a model to test this hypothesis.
- (Option 4) Develop a model(s) in a biological area and validate the model with existing data.
- (Option 5) Develop an interactive software/model that illustrates a biological topic to be used in an educational context.
- (Option 6) Pick a primary article with some quantitative biology techniques and write a report describing and explaining the quantitative techniques to other students in the class. In other words, your audience should be students from this course.
Group structure:
1-3 people per group.
Expectations and Rubric:
The project will be graded with the following rubric:
| Presentation during final exam | 10% |
| Biological question and context clearly stated? | 20% |
| Project clearly defined and fit into biological context? | 15% |
|
Project results (both negative and positive) stated in a clear narrative and addressed to the right audience (fellow classmates)? |
40% |
| Project conclusion wraps up clearly the work done and mentions possible next steps? | 15% |
If your project results in a paper only, it must be a minimum of 2-pages, single-spaced. Figures can of course be used, but make sure they have captions and are part of the narrative (not just filler).
Extra-credit products: Examples of possible extra-credit products produced (if you don't see your approach here, please email me)
- R-Markdown journal or Jupyter notebook.
- Model in possible multiple formats to be uploaded as a Model resource on QUBES.
- Software or teaching module developed and deployed on QUBES (open-source, if possible).
If you produce one of the above 3 products, you will receive extra credit (an additional 0.5 points on your final grade). If you choose to create an R-Markdown journal or Jupyter notebook, there must be some relevant computation and or data analysis in the notebook. In other words, just putting a text-only narrative into a journal or notebook does not count for extra credit.
Presentation Rubric:
Presentations will follow the Pecha Kucha style and take place during our final exam period, which is December 6, 2-5 pm, in our usual classroom (ISC 1280). In our version, you will use exactly 15 slides, where each slide displays for exactly 20 seconds, giving you a total of 5 minutes for you presentation. Since the due date for your project is December 11 at 11:59 pm, your presentation does not need to contain complete project results. Your presentation will be graded using the following rubric:
| Biological question and context clearly stated? | 20% |
| Project clearly defined and fit into biological context? | 20% |
|
Project results (both negative and positive) and/or planned steps stated in a clear narrative and addressed to the right audience (fellow classmates)? |
40% |
| Project conclusion wraps up clearly the work done and mentions possible next steps? | 20% |
You must use Prezi and paste the link to your presentation into the following google sheet.
